

Dashboard Overview
A Dashboard is a central repository for accessing and reviewing groups of metrics. Dashboards are standalone pages in the Anodot UI, and can be accessed from the Anodot Navigation Panel.
The main Dashboards management page, described below, enables you to look at all of your dashboards at a glance, and quickly find the one you need. Each Dashboard can contain a number of user-defined graphs, metrics, or text tiles.
To view and work with classic Dashboards, refer to the Classic Dashboards section.
To access Dashboards
-
From the Navigation Panel, click Dashboards. The Dashboards window is displayed with a grid of currently defined Dashboards, as shown below.
You can also create a new Dashboard by clicking + New Dashboard.
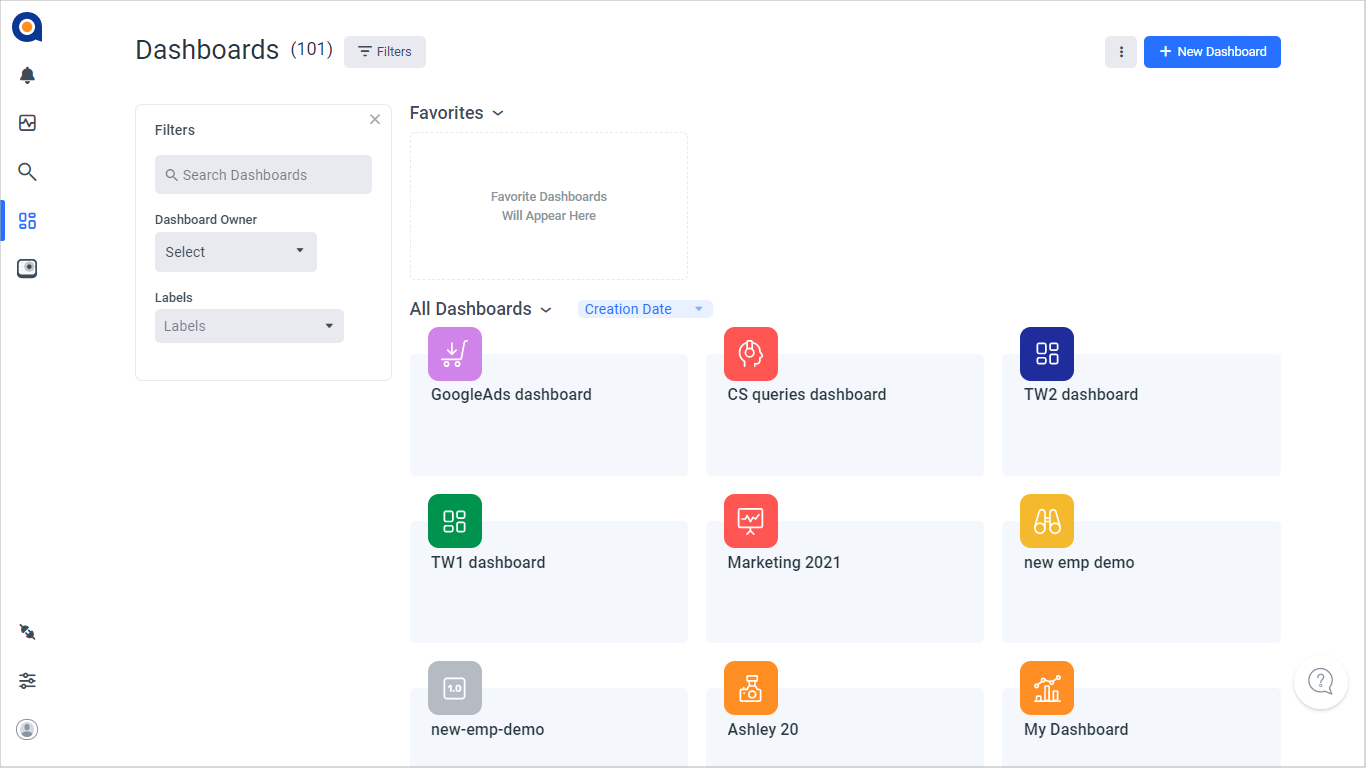
Classic Dashboards are shown in the grid as grey squares
 (displaying 1.0).
-
You can perform a number of actions in the Dashboards window, including:
Action Description View a Dashboard Click on a Dashboard to view it. Create a new Dashboard Click + New Dashboard. In the displayed dialog, define your new Dashboard's settings. For more information, see Create a New Dashboard. Filter the displayed Dashboards Filter the displayed Dashboards
Use the Filters panel to the left of the displayed Dashboards to filter the Dashboards according to name, owner, or labels.Alternatively, use the Last Viewed, Alphabetical, or Creation Date filters.
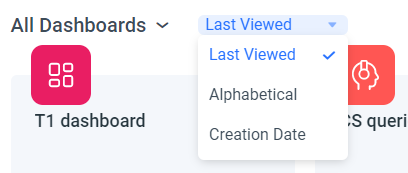
Import a Dashboard Click  and then click Import dashboard from file. For more information, see Importing and Exporting Dashboards .
Create a panel of favorite Dashboards Click the star icon in the Dashboard tile you want to add as a favorite, as shown below.
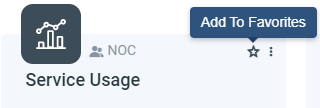
The Dashboard is added to the Favorites panel at the top of the Dashboard window.To remove a Dashboard from the Favorites panel, click on the star icon.
Updated over 1 year ago