

AsPercent
| Description | Returns the percentage of each sample at time t in the input time series of the value of the 'Total' parameter. If ‘Total' is not specified, it is computed as the sum of all samples at time t from all input time series. |
| Input | Series List: Multiple |
| Parameters | Total | Optional, numeric (Total of series values) |
| Output | Transformed Time Series: Multiple |
| Available in | Alerts, Composite, Dashboards |
Applying the AsPercent function on top of more than one metric shows the contribution of each metric to the total as a percentage.
Usage Example 1
The revenue from Channel X is normally 40 to 50% of total income. An anomaly in this case will be detected if the revenue from Channel X drops to 20% of the total income.
Usage Example 2
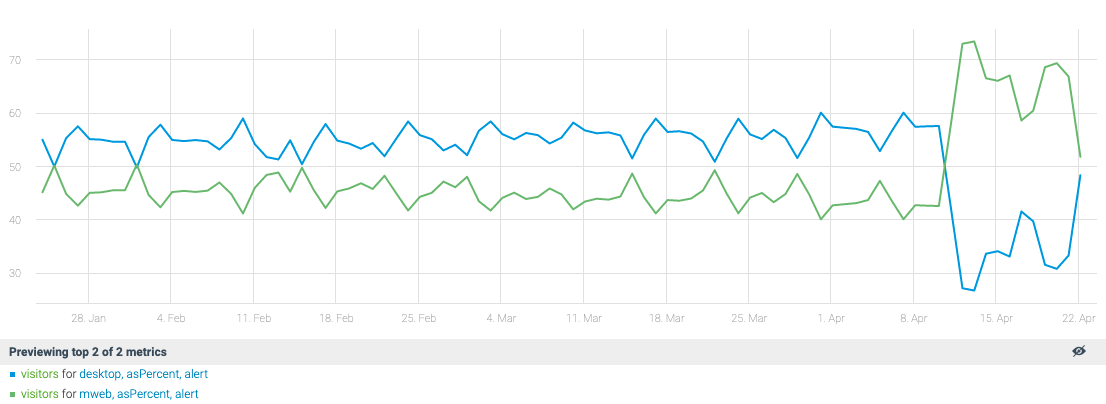
The graph below presents the percentage of visitors to a website coming from 2 sources:
- Web - normal range: 40 to 50%
- Desktop - normal range: 50 to 60%
Total: 100%
The graph shows that around mid-April, the percentage of visitors coming from the web was much higher than usual and the desktop visitor percentage was much lower.
- Web - anomaly range: 55 to 75%
- Desktop - anomaly range: 15 to 45%
Total: 100%
Parameter: Optional. Leave the parameter empty if the data covers 100% of the measure.
For example: There are 2200 active users in total, coming from 3 regions: USA, UK and China.
- Option 1: Anodot includes the data for all the regions - leave the parameter empty.
- Option 2: Anodot includes the data only for the USA and UK - Enter "2200" as the Total parameter to indicate that this is 100% of the active users.
Updated over 1 year ago