

Investigating Alerts

This article takes a quick look at how to investigate and manage your alerts, and includes:
The Alert Console
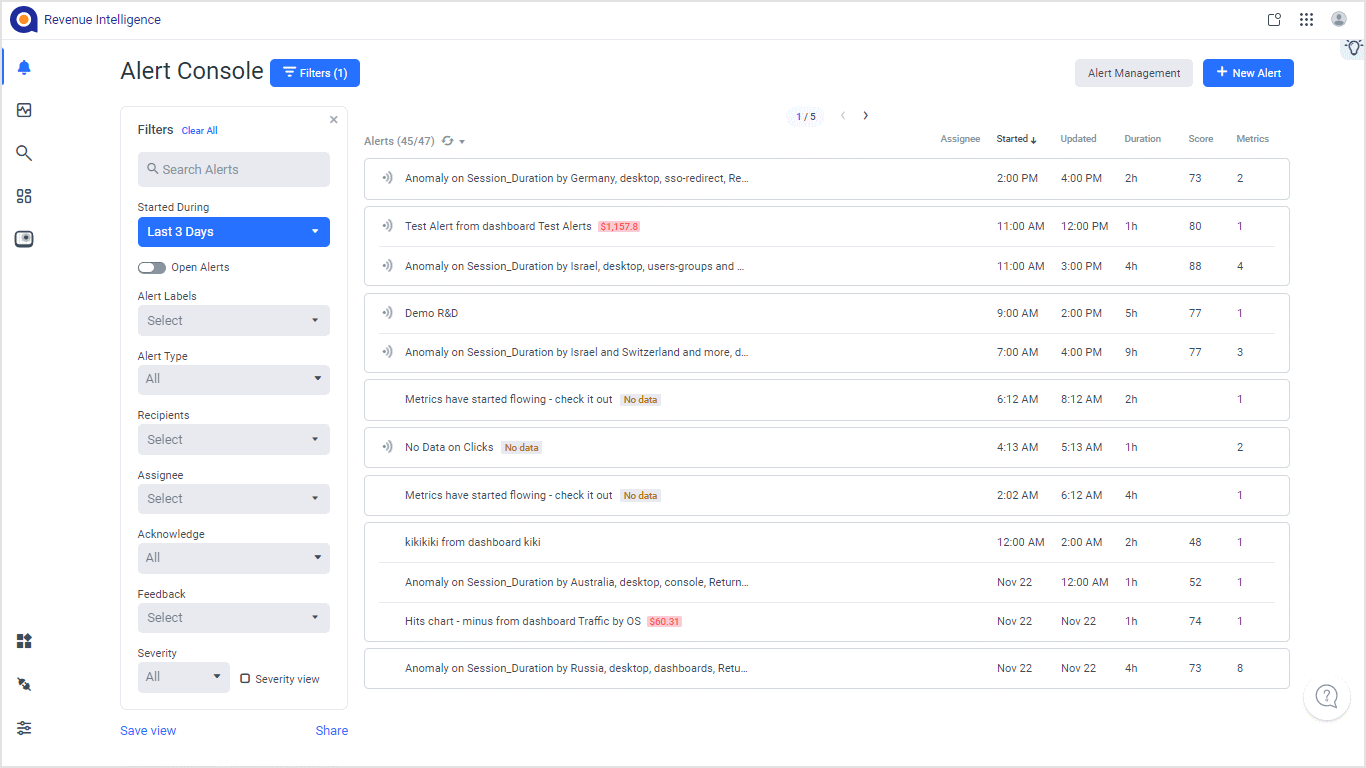
The Alert Console is the 'inbox' of all your Anodot alerts and is the main area for handling the alerts which were triggered. On the Console page you can:
- Filter the alerts. If the Filter panel is not displayed, click the Filters button
- Review Insights into the Alerts generated over the last 7 / 14 / 30 days
- Set the Refresh rate, access Alerts Management and create new alerts .
- Acknowledge Alerts
- Investigate Alerts (see below)
- Tune Alerts (see below)
- Snooze Alerts
- Send us feedback (see below)
Investigating Alerts
Anomaly and Static Threshold Alerts can be investigated from the Console page. You can either Triage an alert or perform a deep investigation. Upon selecting an alert for investigation, Anodot will present you with all the relevant information on the relevant anomalies as well as correlated anomalies.
See Investigating Anomalies for further information.
Providing Feedback
Use the Alert Feedback icons to provide feedback. This feedback (relevant for all alert types: anomaly, static, and no data) enables Anodot to learn from the alerts it generates and whether or not they are relevant for analysis. See Alert Console for more information.
Tuning Alerts
Anomaly and Static Threshold Alerts can be tuned from the Console page. By clicking on the More icon > Tune Alert option in the Alert Console, you can edit a number of alert settings and information. See Alerts Overview for more information.
Updated over 1 year ago