

Filtering Anomalies
This article describes how to sort and filter Anomalies
Sorting Anomalies
Anomaps and Anomalies can be sorted in the main Anomalies window using the following three methods:
- Time Range - This defines the time period for all Anomaps and Anomaly charts. To select a Time Range, open the Time Range menu from the Anomap/Anomalies taskbar.
Time Range is not adjustable at the individual chart level.
- Sort - From the Sort menu in the Anomalies menubar, select from:
- Start date
- Score
- Absolute delta
- Descending / Ascending - From the Desc / Asc menu in the Anomalies menubar, select the relevant option to display.
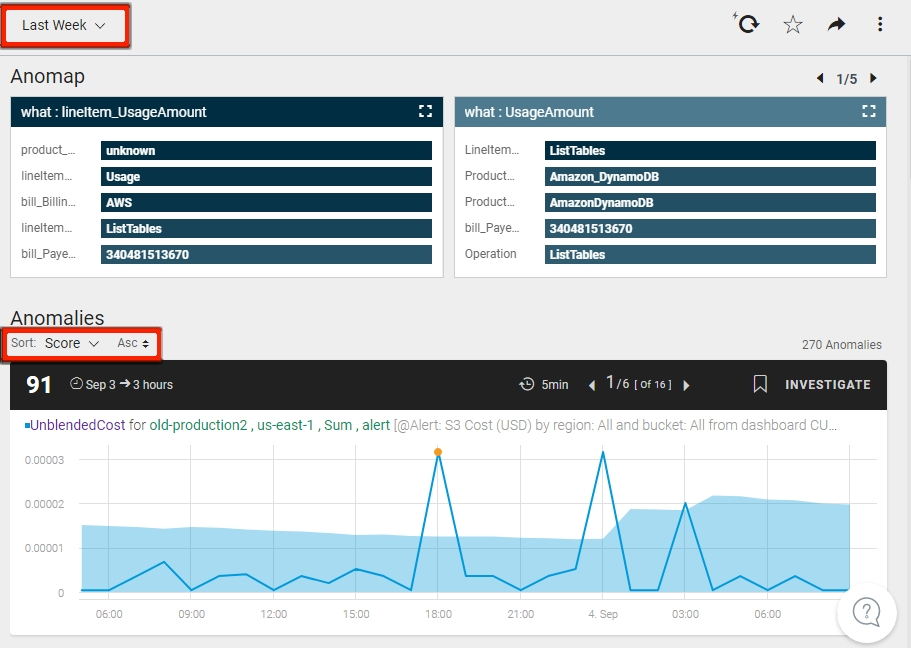
Filtering Anomalies
Anomalies and Anomaps can be filtered by:
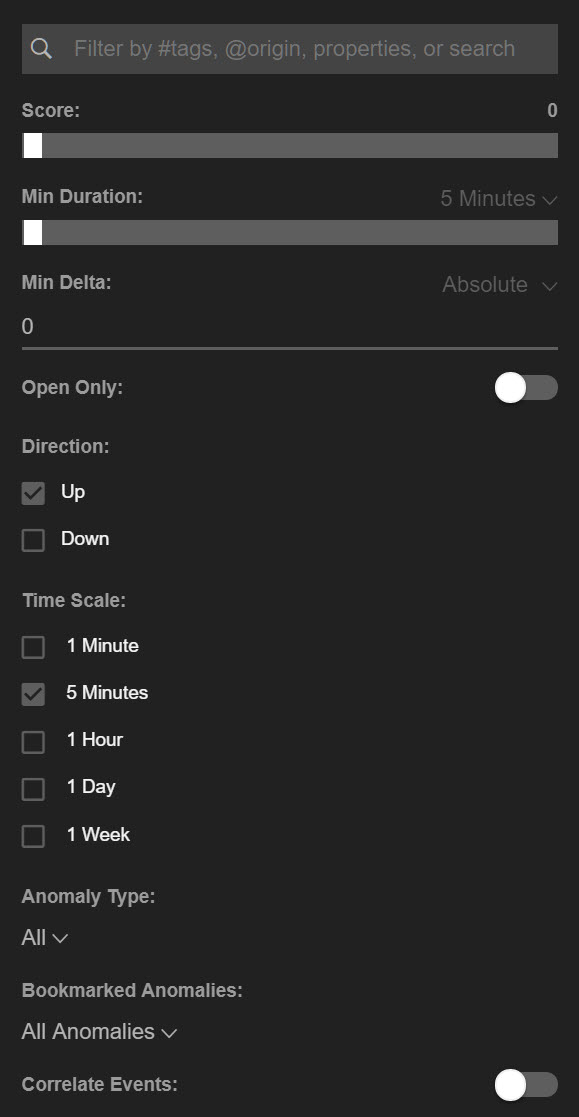
Filter by tags, origins, metric properties and values
Filtering by Tags, Origin, and Properties & Values of Metric Expressions
Tags - Type any property/value pair added to a metric or metric set name.
Origin - Type:
@stream to filter by streams
@composite to filter by composite metrics
@alert to filter by alerts
Properties and values of metric expression - See Metric Expressions.
Filtering by Score
Set level of an anomaly - from 0 to 100
Filtering by Minimum Duration
From 0 to 100 in minutes, hours, or days, up to the limit of the chart time period.
Filtering by Minimum Delta
Select from the following options:
- Absolute Delta: Difference between the peak value of the metric during an anomaly from the normal range
- Percent Delta (%): The percent of change from the normal range to the peak value of an anomaly.
- When setting a value in the Min Delta filter, only anomalies with higher absolute or percentage deltas are displayed in the Anoboard.
Filtering by Status
- Open (ongoing, having not returned to normal range)
- All anomalies
Filtering by Direction
- Orientation from normal range
- Up (higher) and/or Down (lower)
Filtering by Time Scale
- 1 minute
- 5 minutes
- 1 hour
- 1 day
- 1 week
Filtering by Anomaly Type
- All
- Transient - a transient spike in the normal range pattern
- Pattern Change - a change in the normal behavior of the range pattern
Filtering by Bookmarked Anomalies
- Mine - Anomalies bookmarked by me
- Other's - Anomalies bookmarked by other's
- None - Anomalies with no bookmarks
- All Bookmarked - Anomalies with bookmarks
- All Anomalies - Ignore bookmarks when filters
Filtering by Correlated Events
Select to Show/Hide.
Notes
- Filters automatically take effect. The results are displayed in the Anomaps and Anomalies charts.
- Select Save, to save the existing Anomalies tile with the new filters.
- Select Save As to create a new Anomalies tile based on the new filters. A Save dialog box is displayed. enter a name and delete or add tags.
Updated over 1 year ago