

MinimumAbove
| Description | Displays only metrics with values above a specified threshold in the selected time range. |
| Input | Time Series: Multiple (Multiple time-series) |
| Parameters | Threshold | Mandatory, numeric |
| Output | Filtered Time Series: Multiple |
| Available in | Dashboards |
The MinimumAbove function screens out metrics whose minimum value is less than the specified threshold (in the selected time range).
Usage Example
An online gaming company has developed more than a hundred games. As some are more popular than others, the NOC team wants to create a dashboard that displays the number of active users per game - showing only those games that have the most significant usage volume.
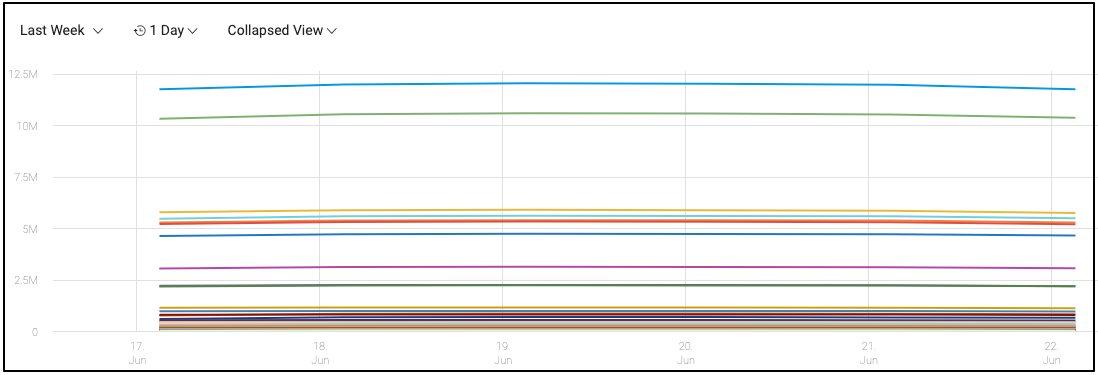
This chart shows the 50 highest average metrics. Note that many metrics have less than 1M active users:
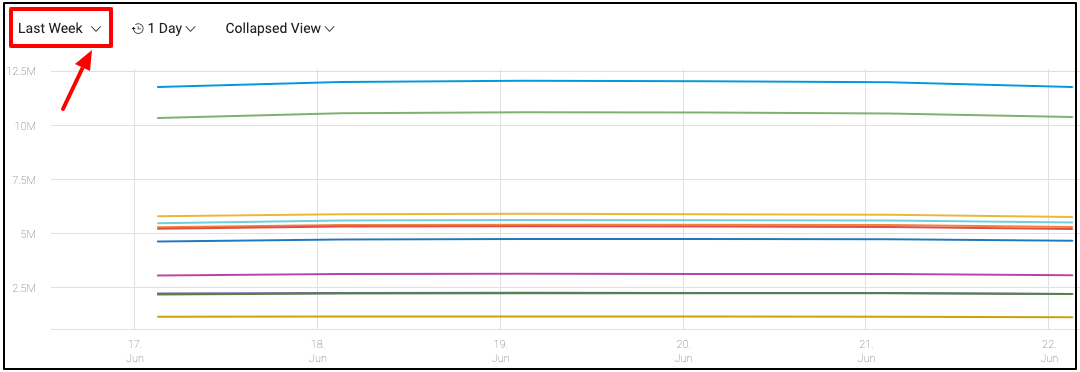
After applying the MinimumAbove function with the value of 1M, the chart is populated with metrics whose minimum value during the last week exceeded that volume:

Updated over 1 year ago
Did this page help you?