

Google Analytics
This article describes the main steps required to create the Google Analytics data collector.
Creating a Google Analytics Data Source
- In the Navigation Panel, go to Integrations >Catalog.
- Use the Search box OR click the Business Packages filter to locate the data source.
- Hover over the Google Analytics tile, and click Start.
*Note: If the data source has already been used, a dialog is displayed in which you can select from one of the listed sources. Alternatively, create a new source by clicking Add a new source. - In the displayed dialog, follow the onscreen instructions.
Creating a Google Analytics Stream Query
If you have just created a Google Analytics data source, skip to step 3.
-
On the Sources page (accessed by clicking Integrations > Sources in the Navigation Panel), choose the Google Analytics source for which you want to create a stream query.
*Note: The streams associated with that source are displayed. If the streams panel is empty, no stream queries exist for that source. -
Hover over the Google Analytics data source, and click + New Stream. The Stream Query page is displayed.
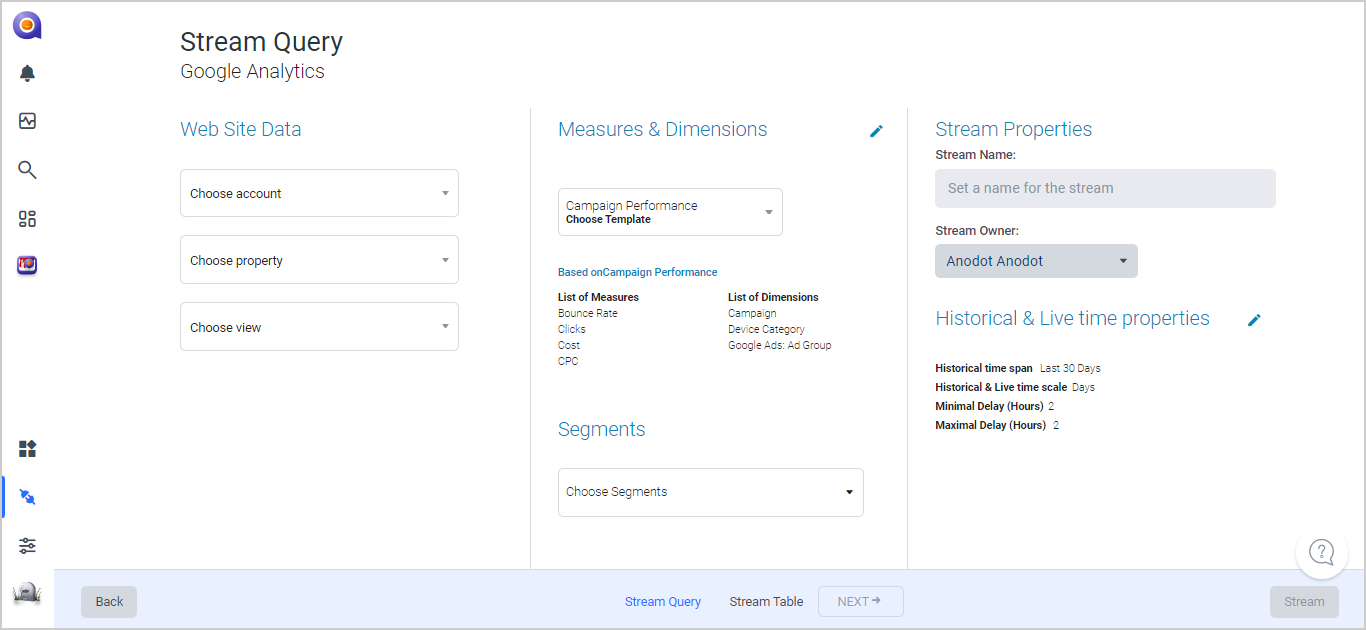
Note: The default Stream name includes a timestamp of when the stream was created. You can edit the name.
-
In the Website Data section, choose:
- An account
- A property
- A view
-
In the Measures & Dimensions section, define the following:
-
A Template or choose measures and dimensions from scratch. The measures and dimensions are based on the template chosen. Use any template as a starting point and add/remove measures and dimensions according to your preferences for that stream.
- The Google Analytics Collector supports custom measure and dimensions.
- A stream query requires a minimum of 1 and a maximum 10 measures, or a minimum of 0 and a maximum of 7 dimensions.
- Choose Segments. The default value is All Users.
*Note: Segments are displayed in the Stream Table in a Segment dimension column and can be fine-tuned the same as any other dimension column.
-
-
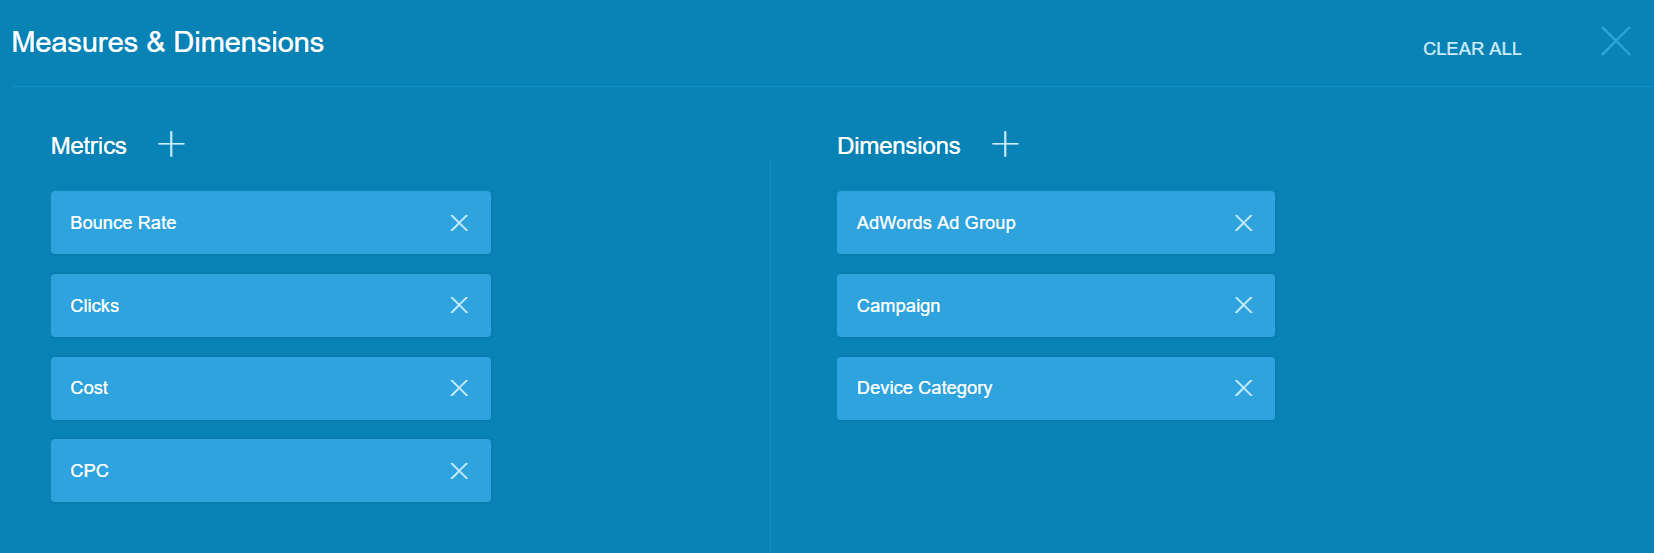
Click the panel edit icon to display the Measures & Dimensions dialog.
-
To add a measure:
Click Metrics +, and from the menu displayed, choose a Group and then one of the available measures.
OR
Enter part of an existing measure name. The system filters measures with that name.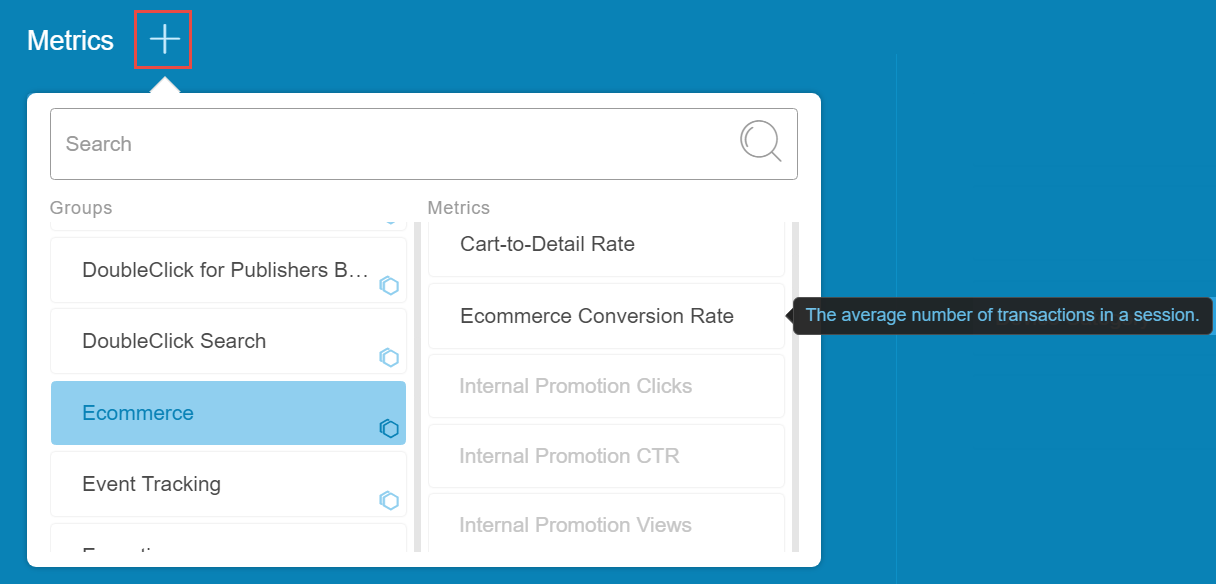
-
To add a dimension:
Click Dimensions +, and from the menu displayed, choose a Group and then one of the available. dimensions.
OR
Enter parts of an existing dimension name. The system will filter dimensions with that name.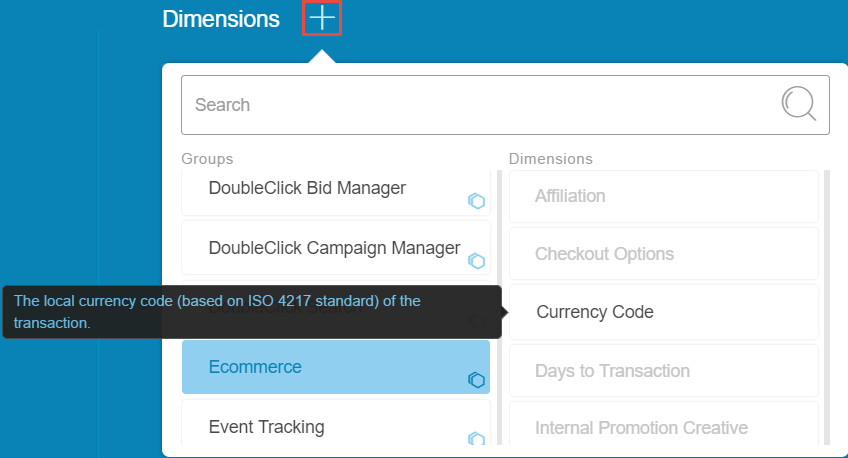
-
Repeat the above steps to adjust the measures and dimensions of your query.
*Note: To clear a measure or a dimension, click the X next to the measure/dimension. -
Click X (in the top right corner of the Measures & Dimensions dialog) to accept the changes and return to the Stream Query window.
-
To edit the Historical & Live time properties in the query, click the panel edit icon.The Historical & Live time properties dialog is displayed.
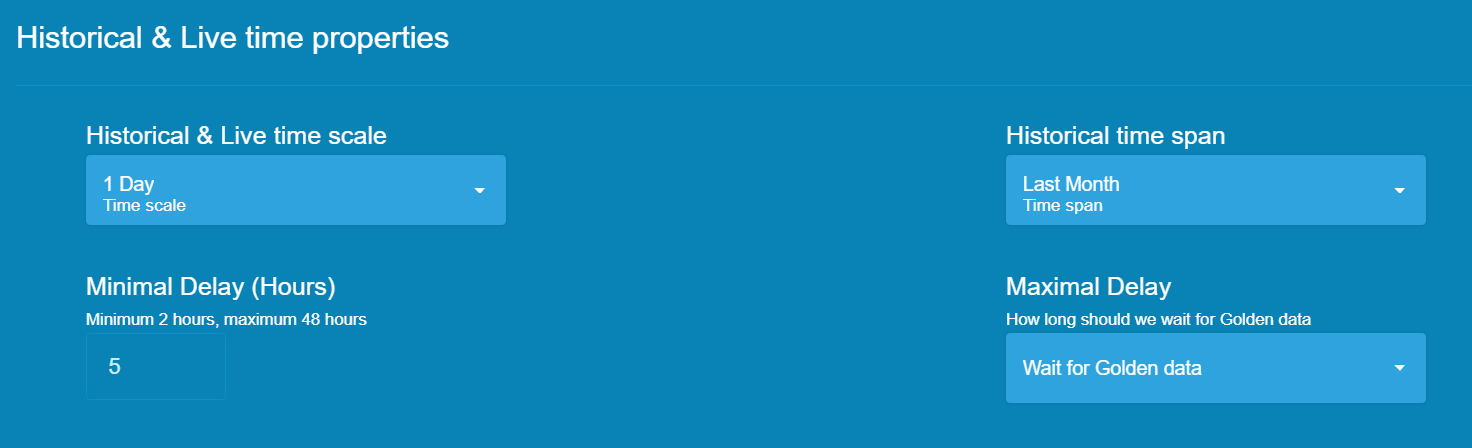
- Choose a time scale [1 Hour/ 1 Day].
- Choose a historical time span.
*Note: The default is Last 3 months/Last day. On an hourly time scale, the maximum span is one month. - Choose a Minimal Delay - Minimum delay 2 hours/ maximum delay 48 hours.
- Choose a Maximal Delay - Select Golden data to wait until all the data has been received or a set number of hours up to 48 hours.
*Note: For specific requirements, Anodot supports 15 and 30-minute intervals, and 0 minutes delay. However, this short interval can cause some of the templates to malfunction. To activate this option, contact [email protected].
-
Click X to accept the changes and return to the Stream Query window.
-
Review the Stream Query window to check the chosen stream data.
-
Click NEXT. The Stream Table is displayed.
Updated over 1 year ago