

Insights Panel
The Insights Panel gives a high-level look at your usage of Anodot, with an emphasis on the value you obtain from the platform.
Accessing the Insights Panel
The Insights Panel is only available from the Alert Console, and is accessed by clicking the "Light Bulb" button in the top right corner of the screen:

To close the Insights Panel, click anywhere outside it on the Anodot application.
Note that some features in Anodot are customer restricted. If you do not see the lightbulb action and would like to see it, please contact your Customer Care Manager or via [email protected].
Selecting the Time Frame
In the top right corner of the Insights Panel you can access the time-frame dropdown option list:
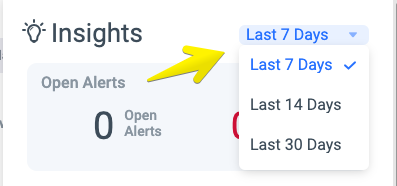
When you select a different entry from the option list, different data is displayed in each of the widgets. However, it will not filter the Alert Console accordingly; see the instructions below for using the Insights Panel to filter alerts .
Widgets
The Insights Panel is comprised of various widgets, arranged according to sections, and described in the following table:
| Section | Widget Name | Details | On Click |
|---|---|---|---|
| Alerts | Open Alerts | Displays all alerts which are currently in "Open" status, split into regular alerts and critical alerts. | Will filter the Alert Console based on which part of the widget was clicked. |
| Alerts Triggered | A historical view of all the alerts which were triggered in the given time frame. | ||
| Alerts Distribution | Displays all alerts triggered in the given time frame according to two parameters: Alert Type and Alert Severity. | Will filter the Alert Console based on which 'slice' of the pie was clicked. | |
| Feedback | Feedback Distribution | Displays distribution of feedback according to "Good Catch" and "Not Interesting". | Will filter the Alert Console based on the feedback type. |
| Feedback per Measure | Displays the breakdown of feedback given according to measures. | Will filter the Alert Console according to the measure clicked (regardless of feedback given). | |
| Top Feedbackers | Displays the top 3 users in the account based on amount of feedback given. | ||
| Usage | Metric Usage | Displays usage of metrics for the account, compared to the licensed number of metrics. The number displayed is month date - i.e. since the beginning of the month. |
Notice that for each widget you can hover over the graphical display to show more information via a tooltip.
Filtering the Alert Console using the Insights Panel
As can be seen in the table above, you can use the Insights Panel to filter the Alert Console. Different widgets will filter according to the data displayed in them.
However, take the following into consideration when filtering:
- The filtering will always be done in the time frame displayed in the dropdown option list at the top. i.e. if you selected "Last 14 days" and clicked on "Critical Alerts" it is the equivalent of choosing in the Alert Console Filter screen "Severity = Critical" and "Started During = Last 14 days".
- Filtering from the Insights Panel will not override any "Saved View" settings you may have defined in the Alert Console.
- Once the Insights Panel is closed, any changes done in the Alert Console filtering will override the panel filtering.
Updated over 1 year ago