

Finding the Average of a Series
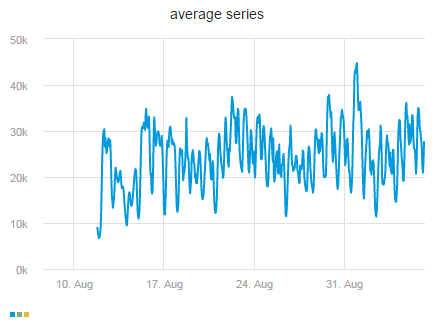
In the following line chart, you can see the average AdTypes at each time sample.
How to use the averageSeries function
- From the Navigation Panel, click Metric Explorer.
- Place the cursor in the blank expression node.
- In the dropdown list, search for AdTypes.
- In the Values dropdown list, select All (*).
- Click Add a Function above the expression
- Type averageSeries or select averageSeries in the dropdown list.
- Save the expression (see the relevant saving sections here).
How to create a line chart
- In the Display Panel toolbar, click
 .
. - In the Chart Type section, select Line.
- Click Apply.
Updated over 1 year ago
Did this page help you?