

Creating a Dashboard Chart Tile
-
Open a Dashboard.
-
Click Add. Select Chart from the drop-down menu. A blank tile is added to the page.
-
To name the tile, hover over the tile and click the Settings icon
 .
. -
Select Settings.
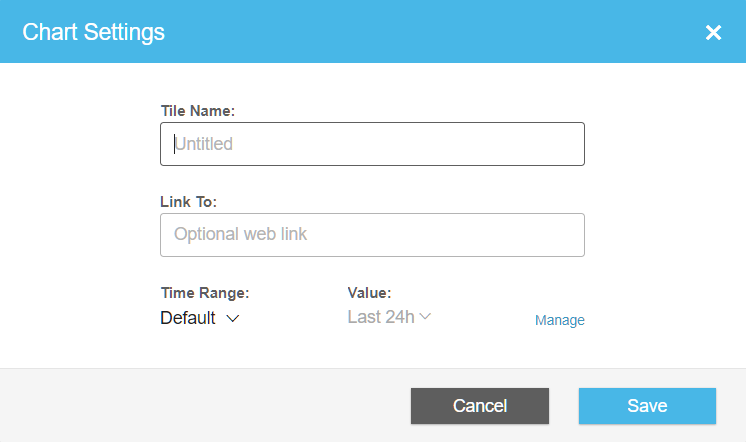
In the Chart Settings dialog box:
- Enter a Chart name
- [_optional_] Enter a web link. Converts the Chart name to a hyperlink to the specified link.
- Click Save
*Note: To set a custom time range see Setting a Custom Time Range per Chart or Meter Tile.
-
To add metrics to the chart, click
 > Settings. The metric expressions definition panel opens. See Building Metric Expressions.
*Note: The results of the parameters selected are immediately displayed in the chart. -
Click Save, the chart is automatically saved to the Dashboard.
Updated over 1 year ago
Did this page help you?