

Anodot Service Usage
This article provides details of the service usage data collected by Anodot. This data is collected on each account by Anodot and can be easily accessed for viewing and monitoring.
Viewing Service Usage Dashboards
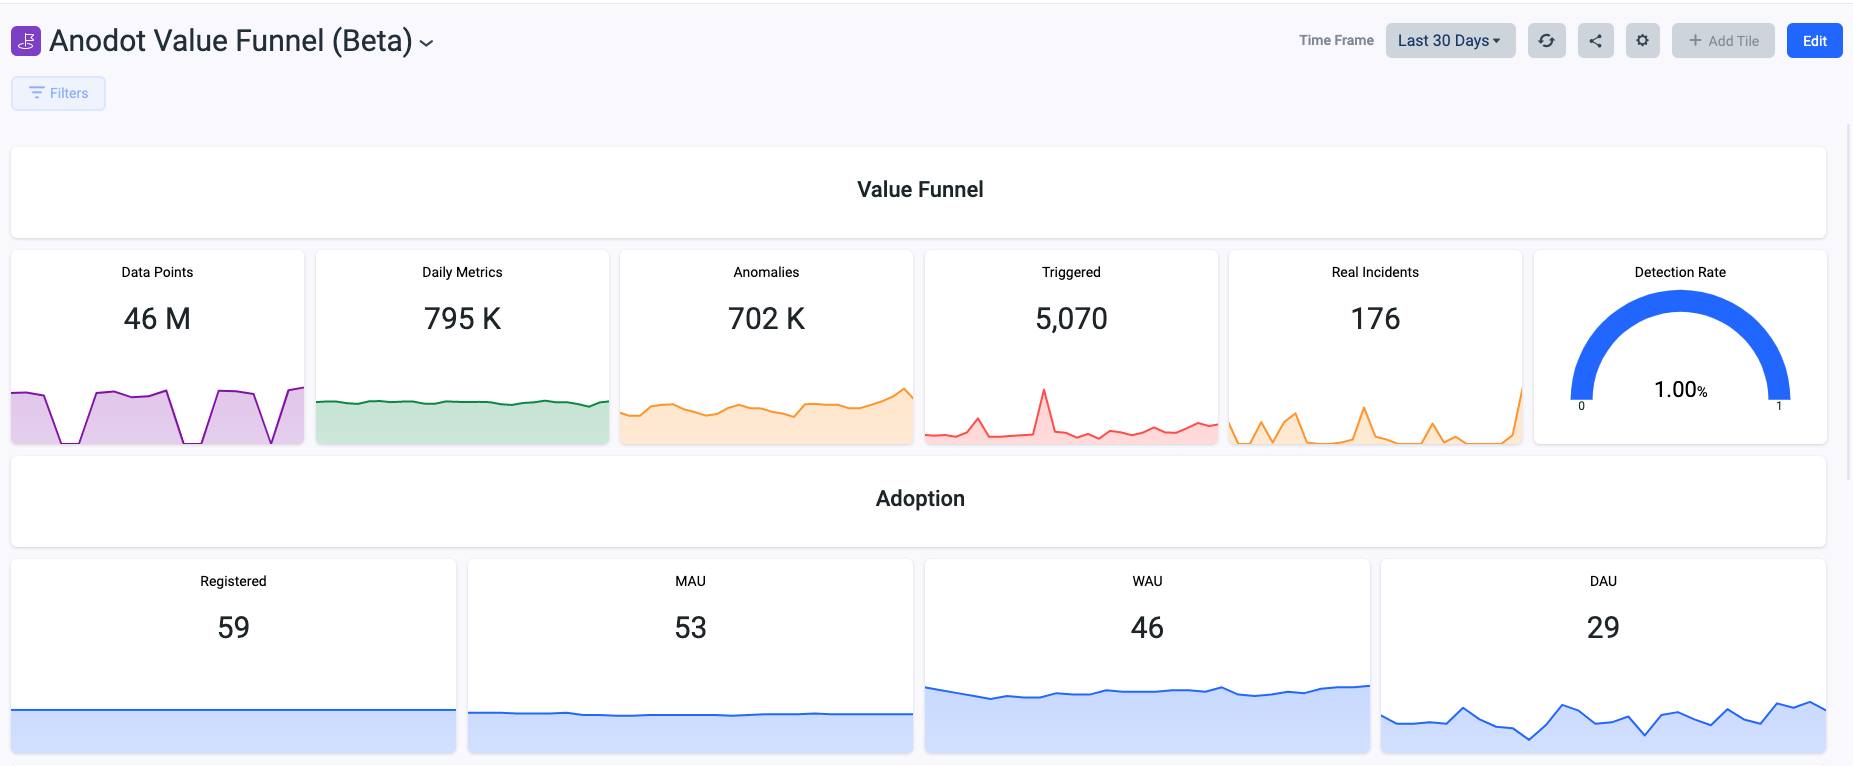
By default, the Anodot Metric Report is installed with your account. This report can be customized according to your requirements.
To view the Anodot Metric Report, from the Navigation Panel, click Dashboards. From the displayed list of Dashboards, click the Anodot Metric Report tile to display the service usage metrics, as shown below.
If you cannot locate the Anodot Metric Report in your Dashboard, you can import it from the attached dashboard below or contact [email protected].
Service Usage Metrics
To view and monitor your account's service usage metrics
-
From the Navigation Panel, click Metric Search.
-
Type the following: service_usage
-
Select from the available list of dimensions and values to view their metrics. For example, if you select originType, you can select the relevant origin value (All, ALERT, COMPOSITE, or STREAM).
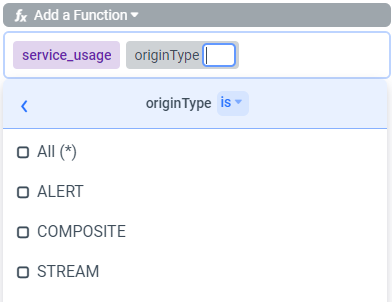
Alternatively, you can select the type dimension, and select from the displayed list of values (Full list below).
The following table lists the available keys and their possible values:
Key Possible Values Description what service_usage Used to calculate the different parts of the Anodot service. type Unique_metrics Total unique metrics at the account level.
Relevant Dimensions:
Interval - daily/monthlyunique_daily_metrics Metrics_origin Unique metric count by origin, not including metrics from APIs.
Relevant Dimensions:
Interval - daily/monthly
originType - Alert, stream, composite
originTitle - Name of the alert, composite, streamdau / total_dau DAU = Daily active users which used the application. TOTAL_DAU = Daily active users which used the application AND viewed alerts in various channels. wau / total_wau WAU = Weekly active users which used the application. TOTAL_WAU = Weekly active users which used the application AND viewed alerts in various channels. mau / total_mau MAU = Monthly active users which used the application. TOTAL_MAU = Monthly active users which used the application AND viewed alerts in various channels. registered_users Number of registered users in the account. dashboards Number of dashboards in the account. alerts Number of alerts defined in the account (Not triggers, alerts!) anoboards Number of anoboards defined in the account. feedbacks Number of feedbacks provided by users in the account.
Relevant dimensions:
origin - where did the feedback come from (e.g. alertConsole, email, slack, api)
feedback - GOOD_CATCH / NOT_INTERESTING.alert_type - anomaly, noData, static
triggered Enables you to see how many alerts were triggered per alert type.
Relevant dimensions:
trigger - Anomaly, noData, static.anomalies Number of anomalies detected by Anodot in the account. Notice that this is counting anomalies from all relevant rollups and with a score of 0. actions Number of alert actions defined in the account. licensed_metrics Number of metrics contracted in the account. channels Number of channels defined in the account.
Relevant dimensions:
channel_type: type of channel being counted (e.g. slackapp, jira, opsgenie)data_points Number of data points processed by Anodot for the account on a daily basis. Examples:
- Number of metrics in the account from the beginning of the month
- The metrics from the start of the month from each stream:
- What = service_usage
- Type = Metrics_origin
- originType = stream
- Interval = monthly
Where are my metrics coming from?
One common use case of leveraging the service_usage metrics is trying to understand where do your metrics come from - i.e. how many metrics were created by your streams, how many by composites and how many by alerts.
By leveraging the 'metric_origin' type in the service_usage metric, you can analyze how many metrics where created by each 'origin'.
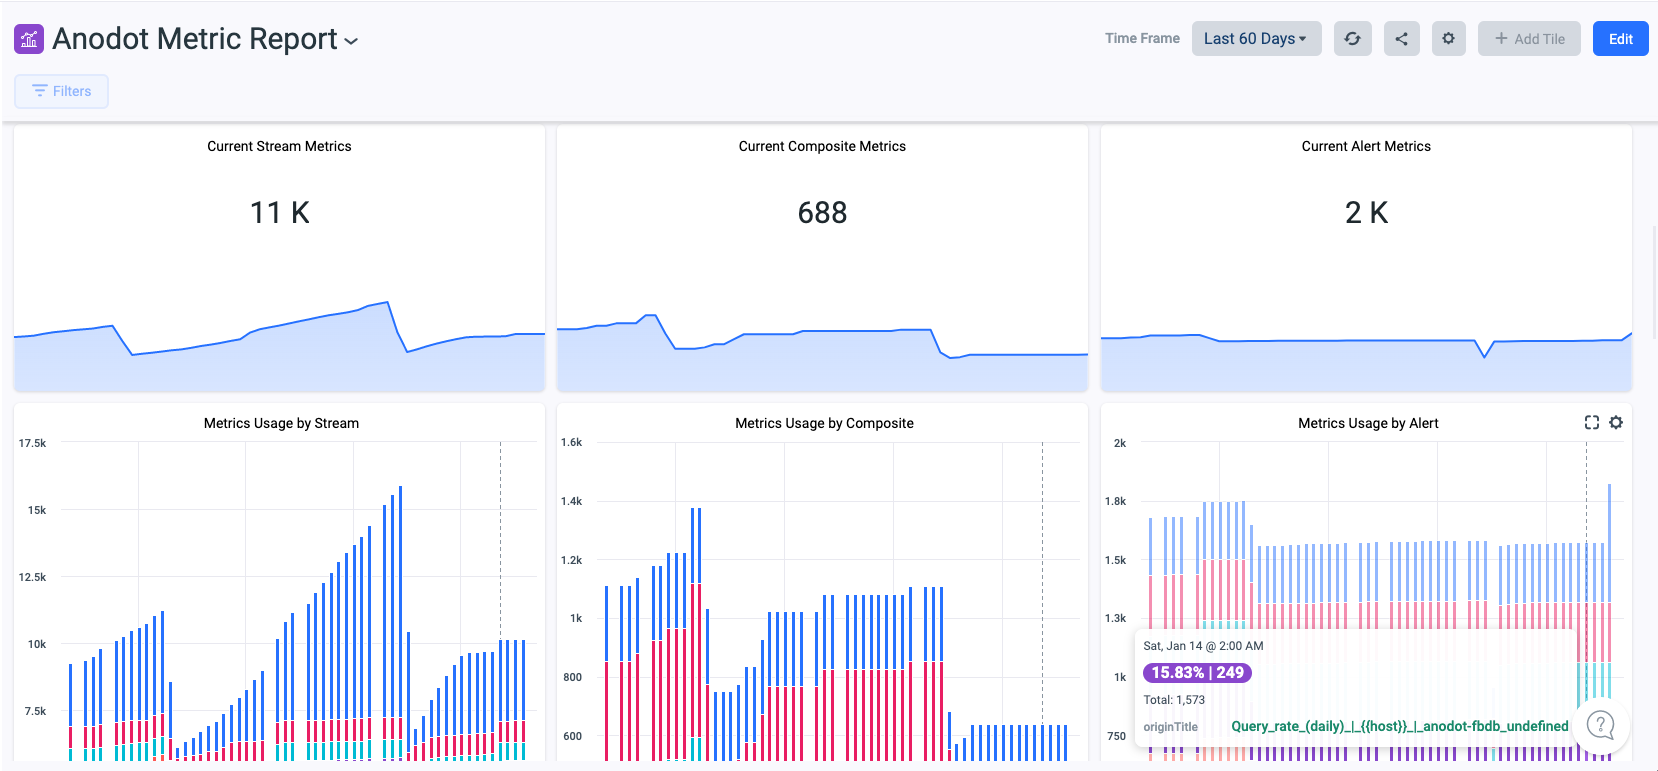
Attached is the Anodot Metric Report dashboard (json) which you can import into your account to understand your metric usage.
Updated over 1 year ago