

Zooming in on Charts
-
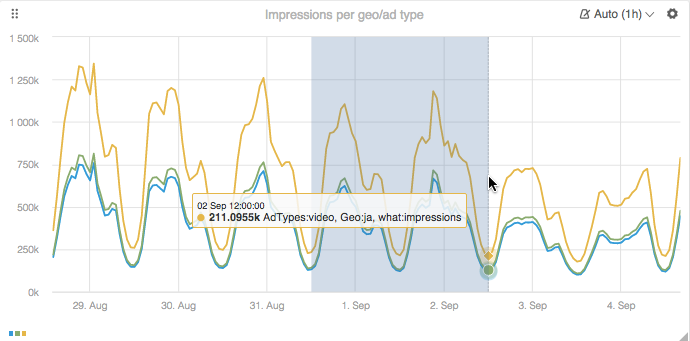
Place the cursor to one side of part of a metric line and while holding the left mouse button down, drag the cursor to the other side of the target area.
-
Adjust the selected area to include the target time range and release the mouse.
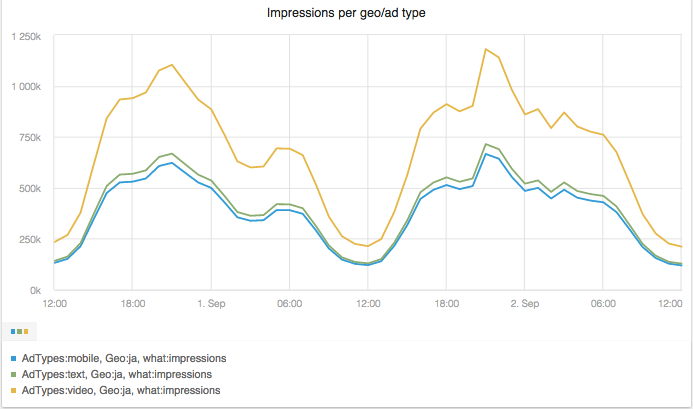
The time scale expands to show greater detail.
-
To reset the zoom, close the tab and reopen the chart.
Updated over 1 year ago
Did this page help you?