

Alert Console
The Alert Console is the repository of all your Anodot alerts.
On the Alert Console page you can:
- Set the Refresh rate, access Alert Management and create new alerts.
- Filter alerts
- Assign alerts
- View the Business Impact
- Acknowledge alerts
- Investigate alerts
- Tune alerts
- Snooze
- Send us Feedback
To access the Alert Console
From the Navigation Panel, click Alerts Console. The Alert Console page is displayed, as shown below.
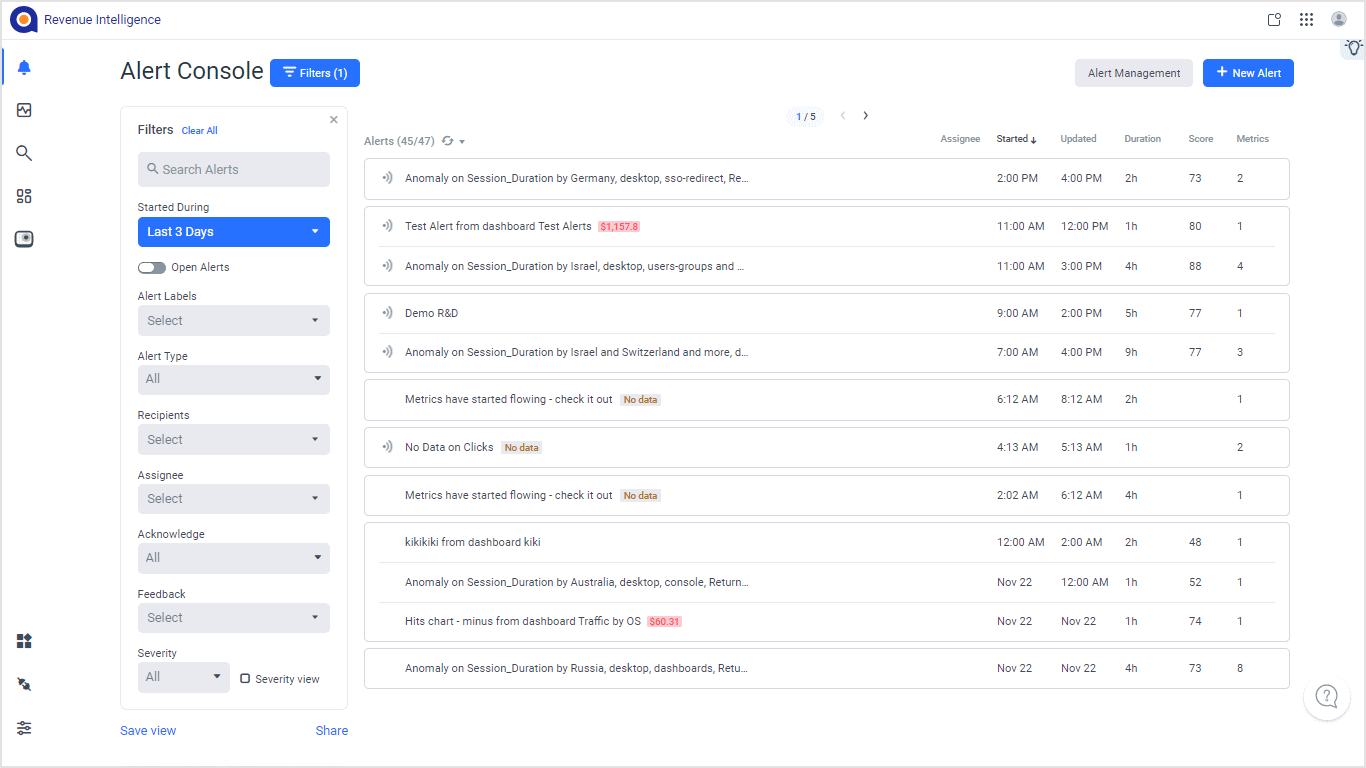
To set a refresh rate for the displayed list, click  (located above the list of alerts) and select from the list of refresh values.
To access the Alert Management page in order to manage and edit the alerts, click Alert Management.
To create a new alert, click + New Alert.
Note
- Use the pagination option above the list of alerts to browse other alerts.
- To show/hide metric graphs, click anywhere within the alert row.
- To change the sort order of any of the alert parameters, hover over the column heading.
- To display the full name of a truncated alert, hover over it.
- To see the exact Started time / Updated time of an alert, hover over it.

In addition, the following columns on the Alert Console page provide general alert information.
| Assignee | The user assigned to the alert |
| Started | When the anomaly started |
| Updated | The last time an alert was updated |
| Duration | The total time from when the anomaly first started to the last time it was updated |
| Score | The Metric anomaly significance score |
| Metrics | The total number of metrics in the alerts notification since the alert started |
Filtering Alerts
To show/hide the Filters panel, click the Filters button. The Alert Console can be filtered using any combination of the following parameters:
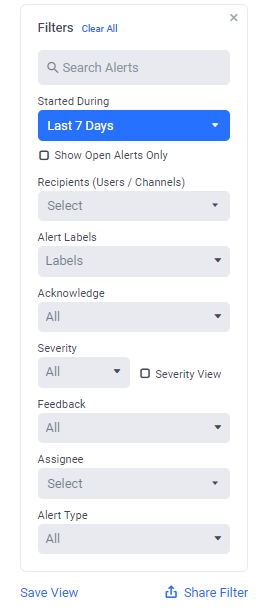
Auto Search - start typing the title or description of the alerts you want to filter.
Choose a time span during which anomalies started. The default is Last 24 hours.
Select to display open alerts only. The default is to show all.
Select a Recipient(s) from the list of Users / Channels.
Select any labels applied to alerts.
Select from All, Acknowledged or Not Acknowledged.
Select the relevant severity (Info, Low, Medium, High, Critical). Select the Severity View checkbox to display severity markers for all alerts.
Select either Marked as "Good Catch" or Marked as "Not Interesting" to provide feedback (relevant for all alert types: anomaly, static, and no data)
Select the relevant Assignee, and Alert Type (Anomaly, Static, No Data).
Click Save View to save your current filters (or click Reset to Default to reset all filters). Click Share Filter to copy the filter to your clipboard.
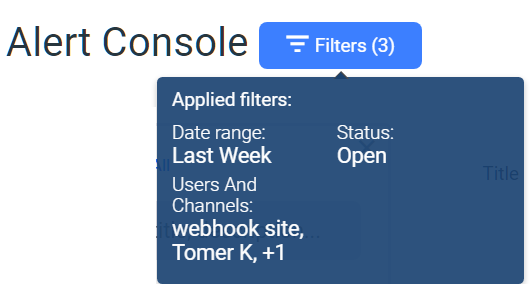
To view the filters applied:
Hover over the Filters button to display a summary of the filters used.
Assigning Alerts
You can assign an alert to any selected user within the Alert Console.
To assign a user to an alert:
-
Hover over the alert row, and in the Assignee column, click the user icon.

-
In the displayed dropdown list, select the relevant user. The user is immediately assigned to the alert and a notification is sent to the user.
-
To remove the assigned user, hover over the user icon and click the X icon, as shown below,

Viewing the Business Impact
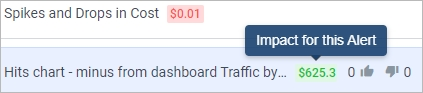
Alerts that have been configured with a Business Impact Value are shown in the Alert Console with a value and currency shown in red (negative impact) or green (positive impact), as defined in the relevant data streams. Note that the value is "stamped" by the opening trigger; the overall value is cumulative throughout the trigger’s metrics.
For further information about configuring and measuring Business Impact values, see Measuring Business Impact.
Acknowledging Alerts
Alerts that are being watched either by you or other users are Acknowledged.
-
To acknowledge an Alert, hover over the Alert you want to watch/not watch, and click the
 icon
icon- The alert is moved to the top of the Alert Console page.
- To see who is watching an alert, hover over the Acknowledge icon to the left of the Start Time.
Investigating Alerts
Anomaly and Static Threshold Alerts can be investigated from the Alert Console page.
- Hover over the alert's row, to display the More icon.
- Click the More icon > Investigate.
See Investigating Anomalies.
Tuning Alerts
Anomaly and Static Threshold Alerts can be tuned from the Alert Console page.
- Hover over the alert's row, to display the More icon.
- Click the More icon > Tune Alert.
See Alerts Overview.
Snoozing Alerts
At times, a metric’s behavior may become erratic and deviate from its expected baseline; for example, during planned maintenance or when a partner stops supporting a specific version. This can lead to several issues:
- Increased alert volume, potentially obscuring other incidents (alert fatigue).
- Degraded learning and prediction accuracy due to corrupted input data.
The Snooze feature helps handling these scenarios:
- Temporarily pause alerting and learning for affected metrics, preventing the issues above.
- Resume learning once the metrics behavior returns to normal.
In the alert console UI, the Snooze feature is applied in the context of a specific alert trigger and, by default, affects all metrics within that trigger (unless customized). During the snooze period, the selected metrics will not generate alerts.
To snooze an alert:
- Hover over the alert row you want to snooze.
- Click the Snooze Alert
icon.
- Choose from the dropdown menu:
- Either a set Standard time-frame for all the metrics in the alert.
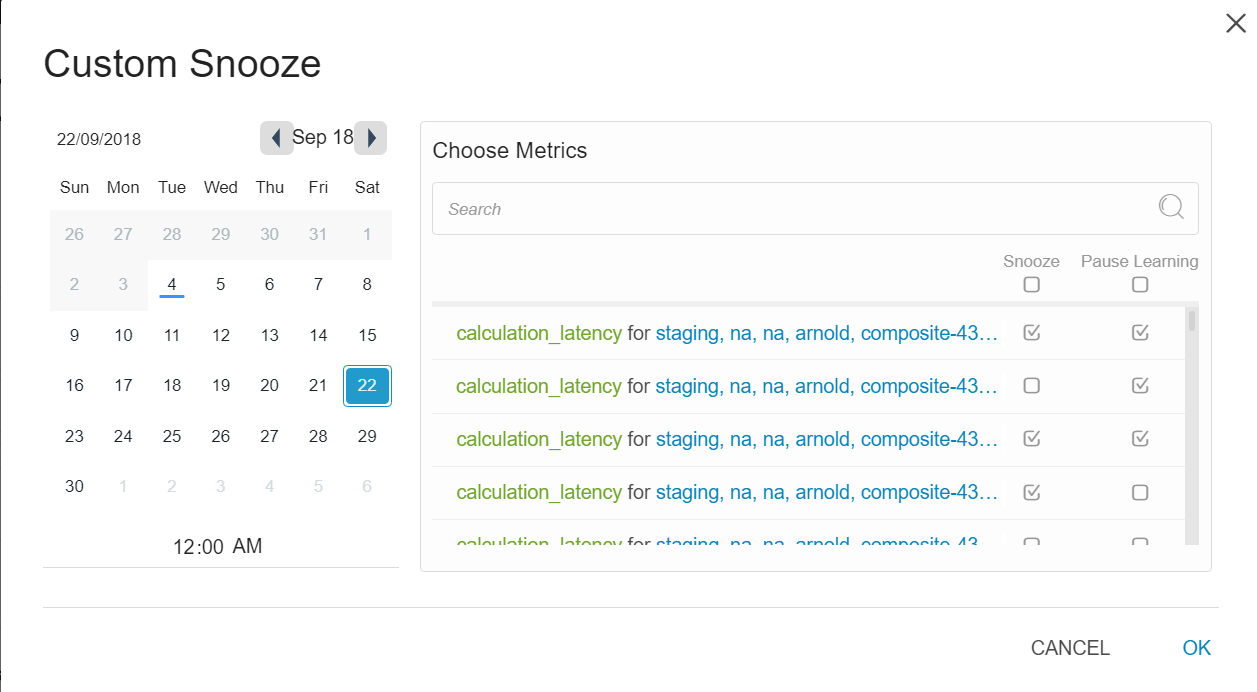
- Or Custom to stop selected metrics from those triggered in the alert for a specified time-period.
- Select which metrics to Snooze.
- Select which metrics to Pause Learning.
By default, Anodot pauses normal behavior learning while a metric is snoozed as we do not want to learn behavior when a user implies that the behavior is not relevant. By deselecting Pause Learning Anodot will continue to learn behavior, as it usually does.
-
In the Custom Snooze dialog box, select the following:
- Snooze Alerts and Pause Learning to pause alerts and learning behavior
(default): on the Alerts Console;
- Pause Learning to pause learning only:
on the Alerts Console;
- Snooze to pause alerts only [deselect Pause Learning]:
on the Alerts Console.
- Snooze Alerts and Pause Learning to pause alerts and learning behavior
Notes
- All users can snooze alerts.
- To end snooze, click the Snooze Alert icon > End Snooze.
- The date under the Snooze icon on the Alert Console page indicates when the snooze period will end; the metrics will re-trigger the alert.
Sending Us Feedback
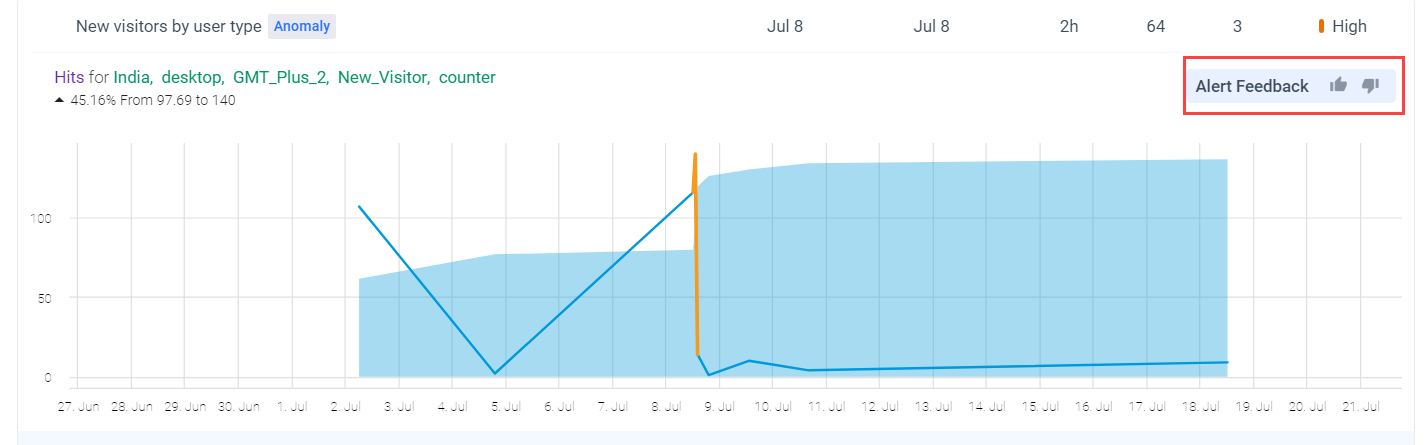
Note that feedback is relevant for all alert types: anomaly, static, and no data.
Updated 5 months ago