

Displaying Metrics in Groups
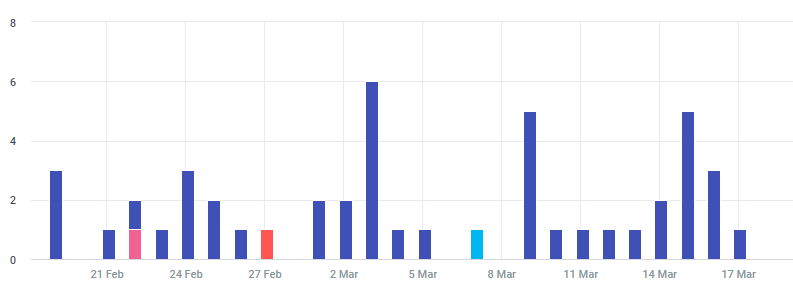
In the following column chart, all new users are grouped by landing page and source.
How to use the groupBy function
-
From the Navigation Panel, click Metric Explorer.
-
Place the cursor in the blank function node.
-
Start typing New Users and select New_Users in the dropdown list.
-
In the Values dropdown list, select Source.
-
Click Add a Function above the expression
-
In the displayed list of functions, select groupBy. Two additional menu options are displayed, Sum and Select.
-
In the middle menu, select Sum from the available options (options are: Avg, Sum, Median, Std, Max, Min).
-
In the right menu, select Page and Source.
The expression tree now contains the following: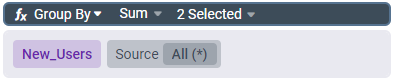
-
Save the expression (see the relevant saving sections here).
How to create a column chart
- In the Display Panel toolbar,click
 .
. - In the Chart Type section, select Column.
- In the Stacking section, select Normal.
- Click Apply.
Updated over 1 year ago
Did this page help you?