

Group
| Description | Groups time-series |
| Input | Time Series: Multiple time-series |
| Parameters | Group By | Mandatory, group by fields |
| Output | Grouped Time Series: Multiple |
| Available in | Alerts, Composites, Dashboards Relevant scope: Optional preliminary step for asPercent and MADDistSeries |
The Group function groups metrics based on one or more dimensions. These groups can then be further manipulated, using additional functions. The Group function by itself has no noticeable effect.
Usage Example
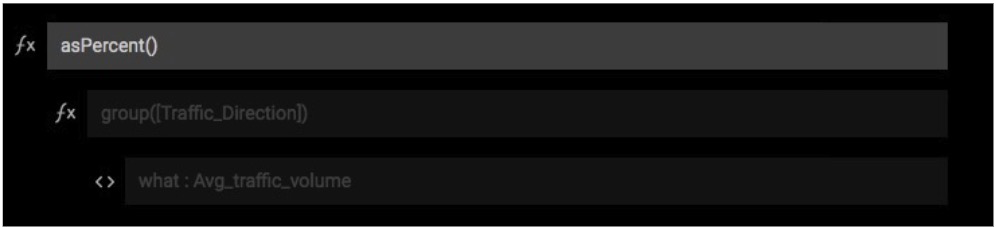
In the example below, the function AsPercent is applied to metrics that measure average traffic volume for different roads, and have been Grouped by the dimension Traffic_direction:
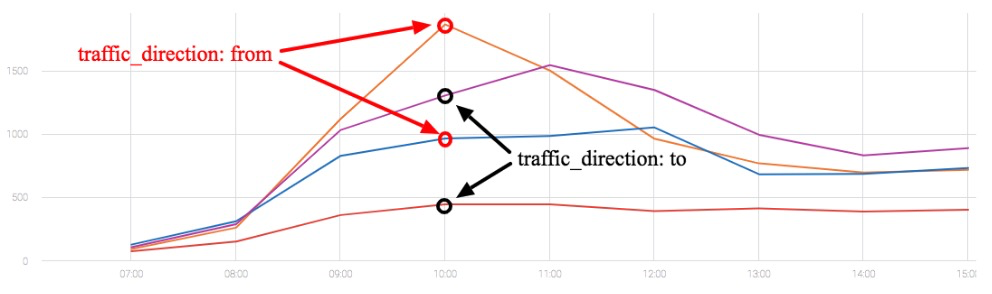
The following chart shows average traffic data before applying any function. There are four metrics (four different roads), two have the property Traffic_direction: to, and two have the property Traffic_direction: from.
After applying the AsPercent and Group functions, the data points in the chart represent the percentage within the two Traffic_direction groups (each adds up to 100%):
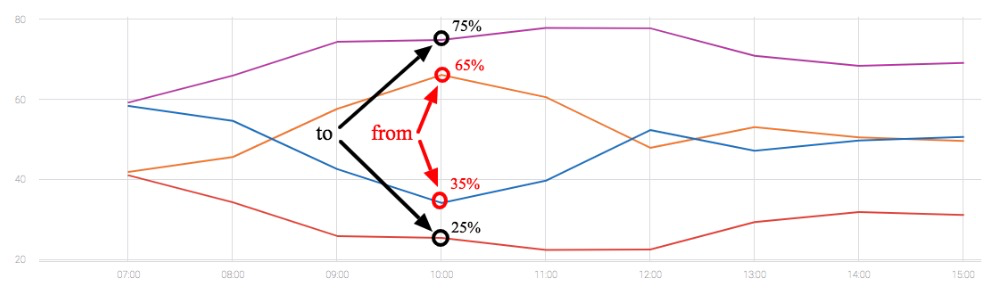
Importantly, this enables the presentation and detection of anomalies in metrics that are measured by their relative contribution to the average. (In this example, by their relative contribution to the average traffic volume in the context of traffic direction.)
Group and GroupBy functions serve different use cases, and should not be confused.
Updated over 1 year ago