
Anodot System Notifications
System notifications are generated when a failure of some sort is detected by Anodot. They typically indicate failures in various entities - the relevant stream, agent pipeline, alert or composite metric - which are currently in an error state and not functioning correctly.
These failures can occur, for example, if there are connection issues, the stream has stopped reporting metrics, or an alert contains no metrics. Each entity has its own error notifications, according to the functionality it covers; these notifications, as well as the actions you can take for each error, are listed in the Types of notifications section below.
When you receive a notification, you can resolve the indicated issue and then resume the stream, as described in Receiving system notifications.
Types of notifications
There are a number of notification types, depending on the entity:
Connection notifications
The following table lists the current error types:
| Error title | What should you do next? |
|---|---|
| Connection authentication failure | Anodot could not connect to the provider so try to find out why (for example, network problems or the provider site is down). |
| Insufficient resource permissions | Anodot could not connect to the source, so try to find out why (for example, a revoked token in the case of Google Analytics). |
| Invalid query | The connection is OK but ensure there are enough grants/permissions for users to access queried resources. |
| Resource not found | Ensure that the queried resource exists, such as an S3 bucket, file folder, etc. |
| Route to resource not found | Verify the route is correct. For example, ensure the host name of the database server is valid. |
| Data type not supported | Ensure the correct data type is supported. For example, csv.zip is NOT supported. |
| Invalid credentials | Ensure the credentials are correct. For example you may have added an invalid Snowflake private key or the Snowflake private key cannot be decrypted. |
| We cannot create the metrics | This may be because you have reached your account metric limit. Try resuming the stream. If the problem persists, contact Anodot Support. |
| We cannot create metrics from the file | Try resuming the stream. If the problem persists, contact Anodot Support. |
| Stream has not been reporting metrics; stopped by Anodot | The stream has not reported any metrics for inactivityDays days, and it has been marked with an error. Try checking your configurations and then restart the stream. See below for more details. |
| Provider service is unreachable | The provider service is unreachable / Anodot could not connect to the data provider. Verfiy there are no network issues or that the provider site is down. |
| Provider - quota exceeded | The data provider refuses requests because too many requests were issued. Try to limit the number of requests. |
| Provider - rate exceeded | The data provider refuses requests that are too frequent based on the time interval. Try to reduce the frequency rate. |
| Provider - internal error | The data provider is unable to respond because of some internal issues. Try to find out what is causing these issues. |
| Connection refused | The connection was refused. Verify that there are no configuration issues, and that the server is currently up and running. |
| Query timed out | The query was activated and failed to respond before a timeout occurred. Try to discover the reason for the response failure. |
| Invalid data | The query was activated but resulted in an error from the server. Try to discover the reason for this error. |
| An unknown server error occurred | Anodot received an error from the server. Ensure that any additional information is provided. |
| No data reported from the stream | No data was reported from the S3 stream. Verify that the stream is still active and can fetch new data. (S3 Only) |
Alert error codes
The following table lists the current alert error types:
| Error title | What should you do next? |
|---|---|
| The alert contains no metrics | Anodot could not find metrics that match the alert search expression. You should verify if this is an error, a change in the metrics, or the alert is no longer needed. |
| The alert contains too many metrics | Anodot found too many metrics that match the alert search expression. As a result, the alert cannot be calculated. You may need to update the alert with a tuned expression to overcome this issue. |
| The alert has influencing events, it contains too many metrics | Anodot could not calculate the alert. You may need to update the alert expression to overcome this issue. |
Composite alert error codes
The following table lists the current composite alert error types:
| Error title | What should you do next? |
|---|---|
| The composite contains no metrics | Anodot could not find metrics that match the composite search expression. You should verify if this is an error, or the composite is no longer needed. |
| The composite contains too many metrics | Anodot found too many metrics that match the composite search expression. As a result, the composite cannot be calculated. You may need to create a composite with a tuned expression to overcome this issue. |
Receiving system notifications
When you receive a notification, you need to resolve the indicated issue and then resume the stream (by clicking the stream's More Options button, and then selecting Resume). You can investigate the issue by clicking on the relevant data stream row displayed in the Sources screen, and then clicking the Collection Log tab in the stream summary window.
Note that you can also click Data Management in the notification message, as shown below, and directly access the relevant data stream or data source.
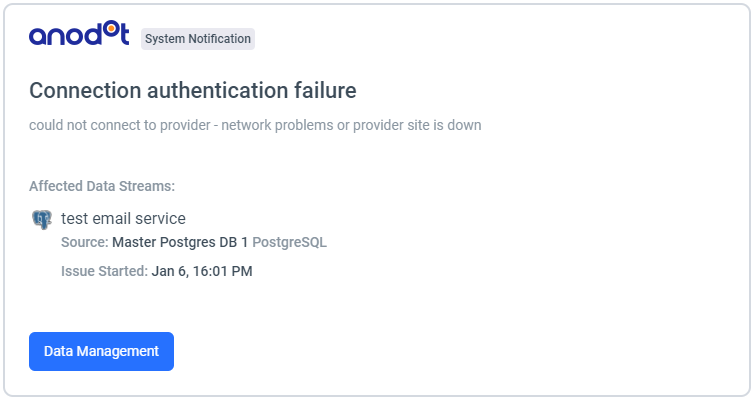
System notification examples
System notifications, such as the two examples below, are sent to the stream/pipeline owner.
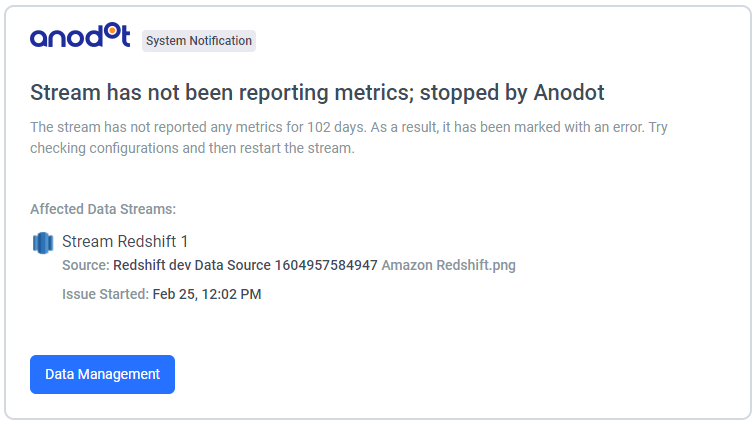
Stream has not been reporting metrics; stopped by Anodot
In the following message, you are informed about a stream that has been automatically stopped by Anodot. The stream was transitioned to the "FAILED' state, because it was not producing any data for a defined period of time. The inactive stream can be resumed, but if it doesn't collect data within 3 days it will be deactivated again. This period of inactivity is defined, as described in Facts & Figures .
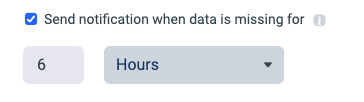
Setting the “no data notification period”
As part of the stream's scheduling options, you can configure the “Send notification when data is missing”. The notification is set according to the following rule:
If no data is found AND the current time is beyond the “last watermark time” + “stream interval” + “no data notification period”, then a notification is issued.
Updated over 1 year ago