

Creating a Meter Tile
A Meter allows you to show the main summary statistic of a single metric. It reduces the metric to a single numeric value by looking at the max, min, average, current or sum of values in the metric. In addition, the Meter provides a color-threshold indicator of the statistic or the tile background.
To Create a Meter Tile
-
Open a Dashboard.
-
Click Add > Meter. A blank tile is added to the page.
-
Click
 > Settings, to name the tile.
 -
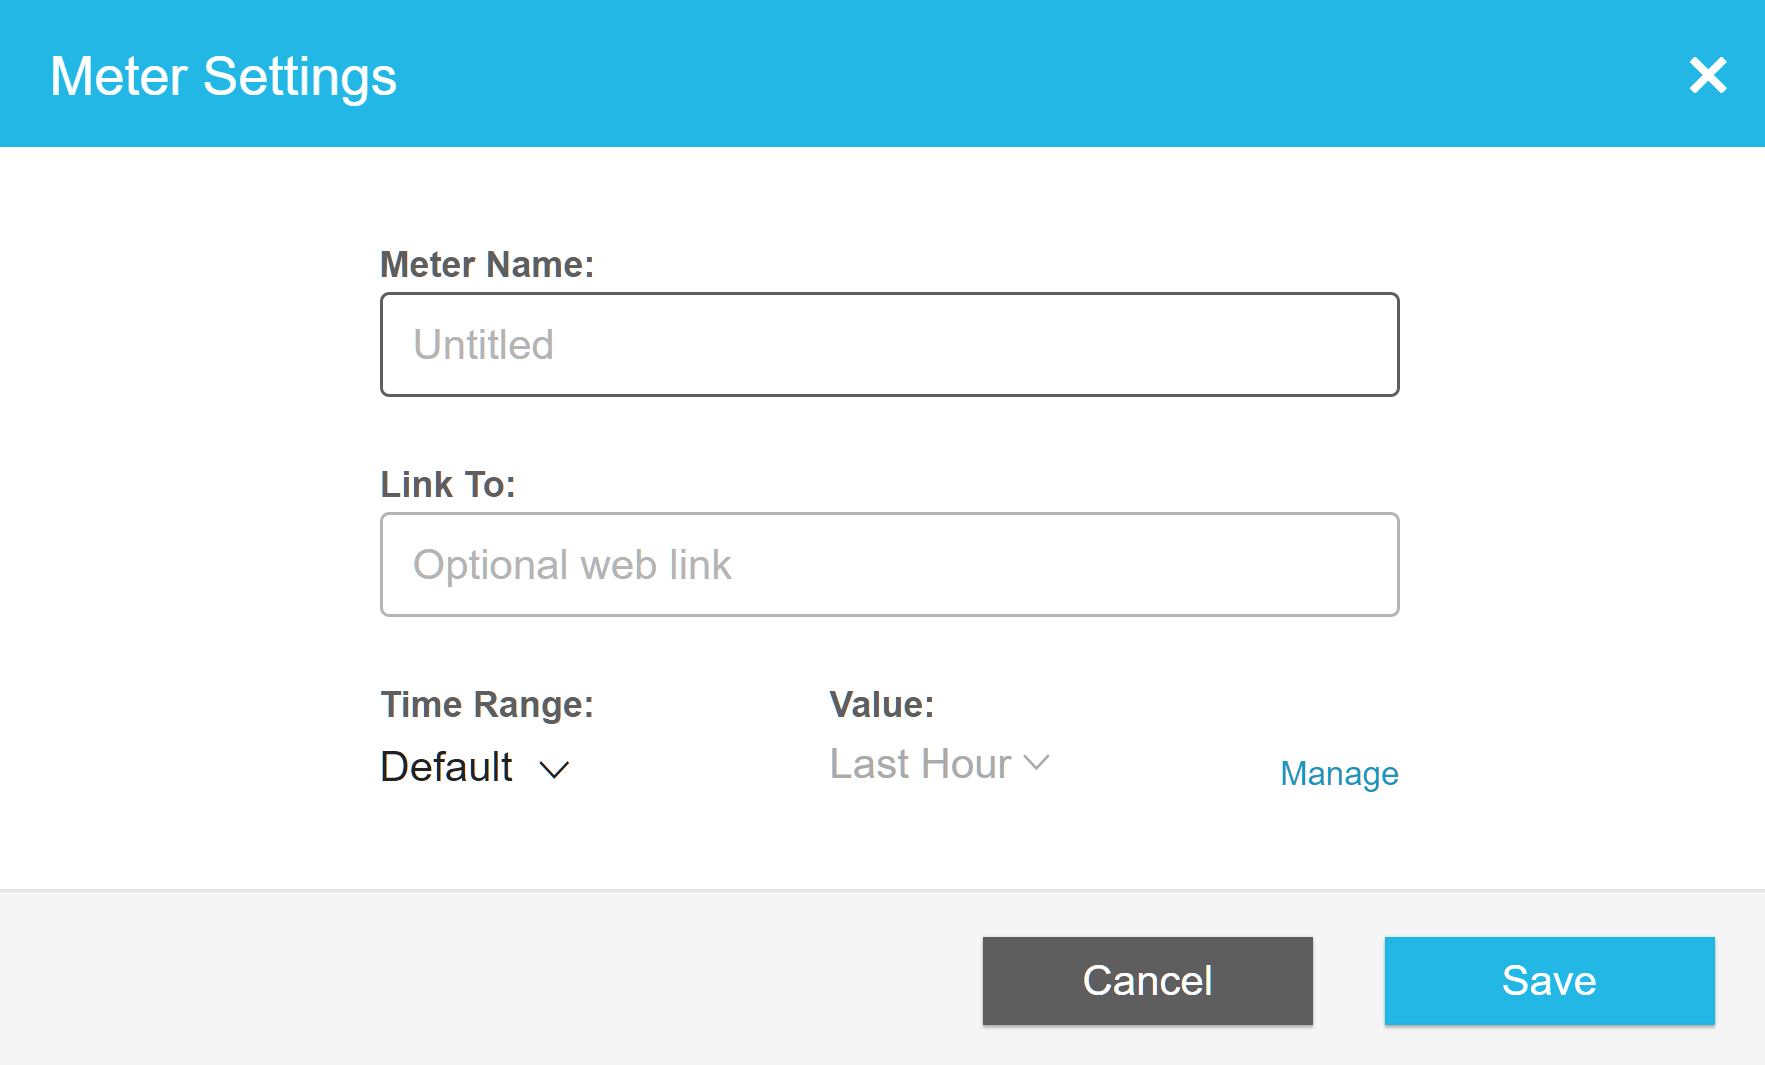
In the Meter Settings dialog box:
-
Enter a Meter name
-
[Optional] Enter a web link. Converts the Meter title to a hyperlink to the specified link.
-
Click Save
To set a custom time range see Setting a Custom Time Range per Chart or Meter Tile.
-
-
To add metrics to the meter, click
 > Metrics . The meter metric definition panel is displayed.
See Metric Expressions.
-
Click Save.
Notes
- To change the meter display settings, see Customizing a Meter.
- To move a tile, hover over the
move icon to display a cross
- drag the tile to a new location.
- To re-size a tile, hover over the lower right corner to display a grey triangle
, drag it to re-size the tile.
- To duplicate a tile, click
- To delete a tile, click
Updated over 1 year ago