

Facts & Figures
This article specifies the current default settings and time limits in Anodot
Retention Periods
Anodot has different types of retention periods:
For how long Anodot keeps raw metric data information.
Alert triggers are retained for the same duration as the metric data they contain within them.
For how long Anodot keeps anomalies data information.
For how long Anodot keeps events data information.
Note
- To change these periods, contact Anodot’s CSM.
- Certain retention rate changes will require an upgrade to Anodot's premium package.
Retention rates by time scale are:
| Time Scale | Metric data Retention | Anomalies Retention | Events Retention |
|---|---|---|---|
| 1 minute | 7 days | s days | 5 years |
| 5 minutes | 30 days | 7 days | 5 years |
| 1 hour | 6 months | 30 days | 5 years |
| 1 day | 1 year | 30 days | 5 years |
| 1 week | 5 yeas | 1 year | 5 years |
First Baseline Creation Time
The first baseline creation time is the minimum time it takes for a new baseline to initialize for a new metric. The baseline creation times by time scale are:
| Time Scale | Baseline Creation Time |
|---|---|
| 1 minute | 1 hour |
| 5 minutes | 5 hours |
| 1 hour | 40 hours |
| 1 day | 10 days |
| 1 week | 6 weeks |
Example:
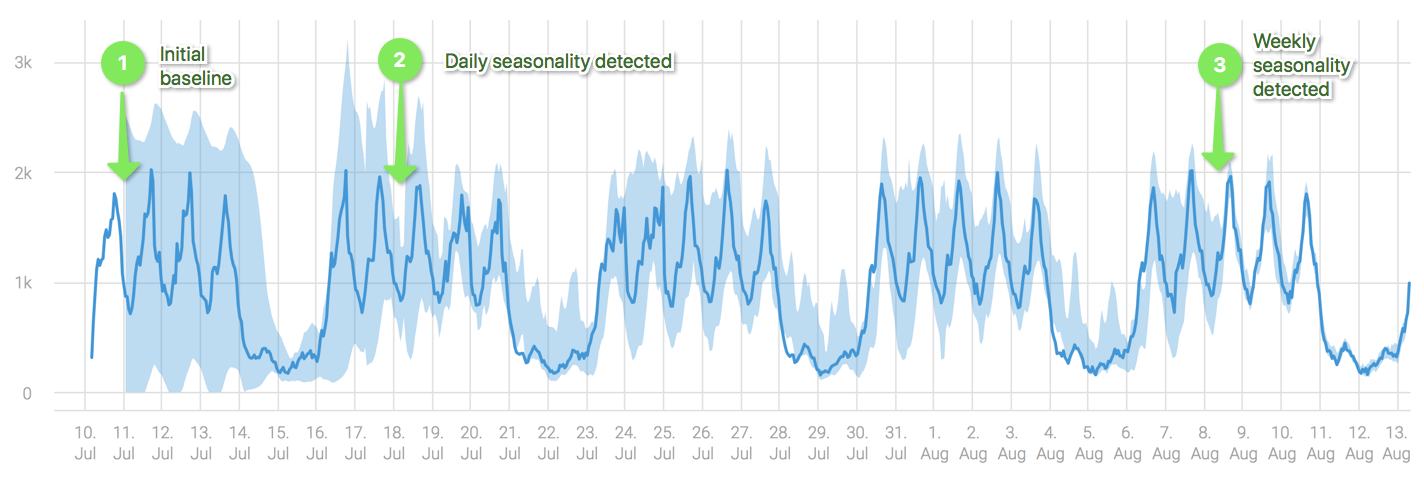
This example shows how after a few hours the initial baseline is created. For the first few days it is very wide; after several days the daily pattern is detected and the baseline becomes narrower. After 4 weeks the weekly seasonal pattern is detected and the baseline becomes very tight.
Seasonality Detection Time
- Seasonal patterns are detected with a minimum time of twice the season length.
- Daily seasonality requires at least 2 days for Anodot to calculate the daily seasonality of a metric.
- Weekly seasonality requires at least 2 weeks for Anodot to calculate the weekly seasonality of a metric.
Not all signal types have seasonality. Seasonality detection is supported only for regular or near regular signals.
Time To Detect First Anomalies
The baseline must be created before Anodot can start detecting new metrics. Anomalies in new metrics receive a lower significance score for the first few days. The times to detect anomalies in a new metric by time scale are:
| Time Scale | Times to detect first anomalies (in new metrics) |
|---|---|
| 1 minute | 1-2 days |
| 5 minutes | 2 days |
| 1 hour | 4 days |
| 1 day | 14 days |
| 1 week | 8 weeks |
Time To Close An Anomaly
An anomaly will start on the first data point that is outside the baseline. To close an anomaly, Anodot needs to have several data points within the baseline. The time it takes to close anomalies by time scale are:
| Time Scale | Number of Data Points Required Within the Baseline to Close an Anomaly |
|---|---|
| 1 minute | 3 |
| 5 minutes | 3 |
| 1 hour | 2 |
| 1 day | 1 |
| 1 week | 1 |
Note - Open alerts that do not receive data for 4 days, are closed on the fourth day.
Time To Resume Learning
Whenever Anodot detects an anomaly, the AI stops learning normal behavior. This is done to prevent learning an anomaly's behavior too soon as this may affect the baseline too early, thus generating false positive alerts later on. The time it takes Anodot to resume learning depends on the time scale.
The learning resume-times by time scale are:
| Time Scale | Time to Resume Learning |
|---|---|
| 1 minute | Resume learning after 2.5 hours since the anomaly started |
| 5 minutes | Resume learning after 6 hours since the anomaly started |
| 1 hour | Resume learning after 12 hours since the anomaly started |
| 1 day | Resume learning after 72 hours since the anomaly started |
| 1 week | Resume learning after 3 weeks since the anomaly started |
Alerts Simulation Limits
The minimum amount of data points required to run simulations. The maximum number of points over which a simulation can be run is 5 million data points.
| Time Scale | Data Points | Time Period | Maximal Number of Metrics for Simulation |
|---|---|---|---|
| 1 minute | 7200¹ | 5 days¹ | 695 |
| 5 minutes | 1440² | cast² | 3470 |
| 1 hour | 96 | 4 days | 52,080 |
| 1 day | 4 | 4 days | Maximal number of metrics in an alert |
| 1 week | 4 | 4 weeks | Maximal number of metrics in an alert |
¹ For 1 minute interval, the number of data points may be reduced to 3600 data points for periods longer than 10 days to allow for simulation when metrics are sparse.
² For 5 minutes interval, the number of data points may be reduced to 760 data points for periods longer than 10 days to allow for simulation when metrics are sparse.
Event Correlation To Alerts
Events in alerts are used with regards to the alert’s timescale and the start time.
| Time Scale | Time Back for Events |
|---|---|
| 1 minute | 4 hours |
| 5 minutes | 4 hours |
| 1 hour | 2 days |
| 1 day | 3 days |
| 1 week | 3 days |
Data Collector Stream Limits
If a data collector stream fails to send data for a defined number of days, as listed below, it is moved to an error state and shut down.
| Collection Interval | Number of Days |
|---|---|
| Daily | 60 |
| Between daily and hourly | 14 |
| Below hourly | 7 |
Other Defaults
- Metrics limit - The number of live, unique metrics are based on a customer’s contract.
Anodot will ignore data points if this limit is breached. Either reduce the number of metrics or increase your contract metrics quota. - EPS limit - The number of data points, calculated over a period of 1 minute.
For example: the limit of 6K EPS is 360,000 points in one minute.
Customer-default is 2K EPS; this will be increased based on the number of unique metrics package. The same applies to the events API limit. - Samples in a single request - A single API request may contain up to 10,000 samples. Larger requests should be divided in to multiple, smaller requests. Anodot recommends sending up to 1000 data points per request. If more than 1000 data points are needed (up to 10,000), the request must meet the EPS limit.
- /#of Concurrent Data Connections - the maximum between 100 and the # of metrics/1,000 (i.e. for 1M metrics, 1,000 connections).
- Tags limit - Tags can be associated up to 500K metrics in one API call.
- Composite limits - Composite can compose by default up to 500K unique metrics.
- Number of metrics in a single alert - The number of unique metrics in a single alert setting (without composite) is 150K unique metrics.
- Number of configured alerts - the total number of alerts must not exceed 1000 alerts.
- Max correlated alerts in one Anomaly - 2000 metrics can be correlated in one Anomaly.
- Max number of data sources in an account - 100.
- Max number of active & paused streams in an account - 100
- Max number of incomplete streams in an account - 50
Updated over 1 year ago