

Introduction to Collecting and Streaming Data
Anodot's Data Collectors enable you to stream your measures and dimensions through Anodot's machine learning algorithms to rapidly find anomalies in your data.
Overview
To stream data into Anodot, either from a website source or to upload a file from your local drive, you will need to integrate the relevant Data Collector from the Anodot Catalog. For further details on the currently supported data sources and their collectors, see this list.
Browsing the Anodot Catalog
The Anodot Catalog provides quick and easy access to all the available Data Collectors. To access the Catalog, select Integrations > Catalog from the Navigation Panel.
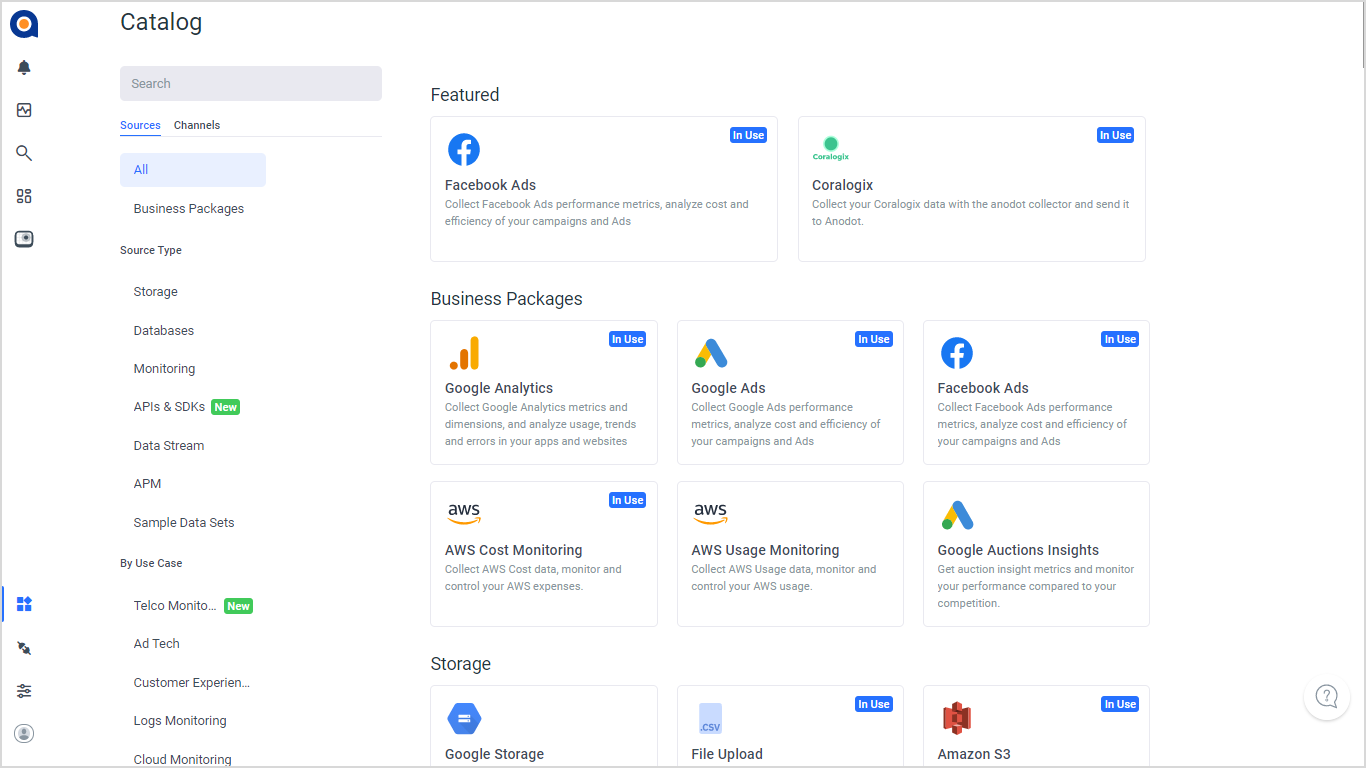
You can filter and search the available Data Collectors by using the filters on the left of the screen; search for a specific collector using the Search box, or click on the various filters to display the relevant source types. For example, click the Databases filter to display only the collectors relevant for database source types.
After you have filtered the list and located the relevant collector, hover over the collector tile and click Start (and follow the onscreen instructions for each collector, as listed here) or Instructions (to open the relevant Knowledge Base page) to configure the collector.
Viewing existing integrations
To view existing integrations, select Integrations > Sources from the Navigation Panel. By default, all current data streams are displayed.
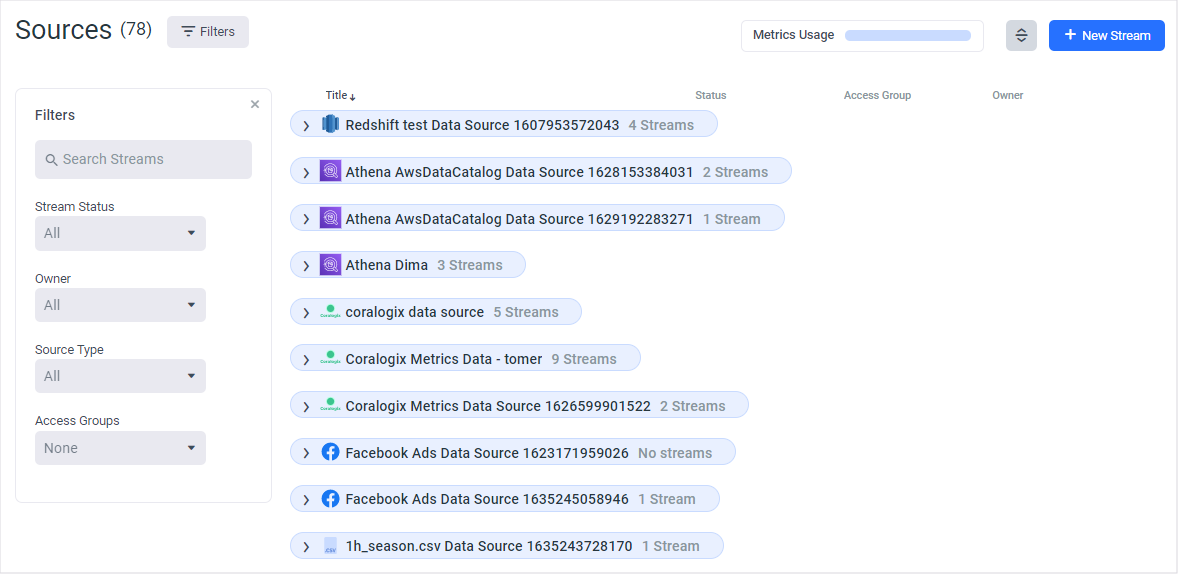
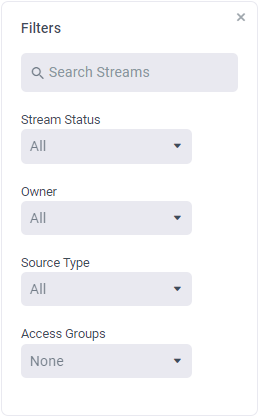
To filter the displayed list to display streams associated with a specific source, click in the Source Type option box and select the relevant source types from the displayed list. Note that if Role Based Access Control (RBAC) is enabled in your account, you can also select the relevant streams for a specific Access Group.
To expand/collapse the displayed list of streams, click the collapse/expand button in the top right corner of the screen.

The Metrics Usage bar shows the current usage of metrics for your account.
Data Sources
As described in the previous section, you can filter the displayed data sources to show only the streams relevant for a specific data source.
You can also perform the following:
-
Add a new data source, as described in Adding New Data Sources .
-
View and/or rename a data source by selecting the data source in the Source Type option box, hovering over the relevant source in the displayed list, and clicking the Edit (pencil) icon, as shown below.

-
Delete a source by clicking the More icon and selecting Delete.

Adding New Data Sources
-
In the Sources screen (as shown in the Viewing existing integrations section above), click + New Stream in the top right corner.
-
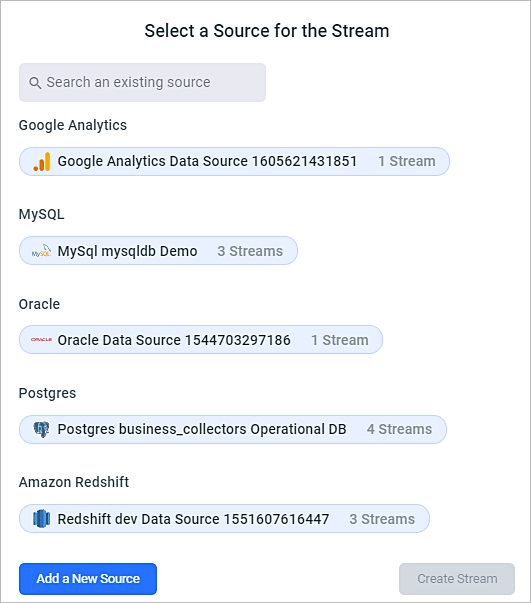
In the displayed dialog, click Add a New Source.
-
In the displayed Anodot Catalog, locate the relevant data source.
Then click Start and follow the onscreen instructions.
OR
Click Instructions to open the relevant Knowledge Base page.For further details on defining each of the available data sources, see Guidelines by Data Source Type .
Note: If you do not see your data source, use the Search box in the top left corner.
Data Streams
Stream status
The current status of stream queries is shown in the list of streams. To view, change the status or edit the query, highlight the stream query you want to change, and click the More icon.

Queries can be changed as follows:
| Status | Description | Click to: |
|---|---|---|
| Live | Historical data gathered or live data being gathered |
|
| Initializing | Runs through the five intializing phases for each stream:
|
|
| In Progress | Gathering historical data, that has not reached the present date |
|
| Paused | A Live or Initialized data stream was paused by a user |
|
| Incomplete | The stream definition has not been completed |
|
| Done | For uploaded files only - streaming completed |
|
| Error | The stream is in an error state |
|
¹ Renaming a Stream
- Changes the stream reference to the metrics created from that stream.
- In Alerts/Composites/Anoboards/Dashboards, if the stream name is used without wildcards in an alert expression, it will be replaced in the expression automatically. If it is used with wildcards, the expression will not be changed automatically and you will need to change it manually.
Creating Stream Queries
Each source can hold several stream queries. The following steps describe how to create new queries:
- Define a stream query per the requirements of the data source, including data to collect (measures, dimensions, and timestamp), and collection scheduling. See Creating a Stream Query from a Database or the guidelines for the specific data source.
- Review the data in the Stream Table before processing it to Anodot.
*Note: To create more meaningful metrics, you can transform and filter the measures and dimensions from the data collectors before streaming the data. See Stream Tables , Measure Columns , and Dimension Columns .
Updated over 1 year ago