You can use Statsd for aggregating raw events and values of events into time-series metrics.
A raw event can be an event when some user viewed an article, or the price paid for a particular article.
A time-series metric consists of a series of measurements of some quantity, each with its own timestamp. For example, the series of number of views of an article or an ad over each minute of the day, or the average price paid for an article or an ad during each minute of the day.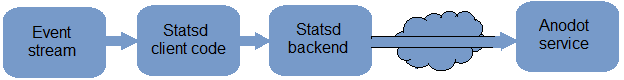
Architecture for sending metrics to Anodot
The above diagram describes the architecture of the components required to transform raw events to time-series metrics and sending them to the Anodot service.
The flow consists of the following steps:
- The raw events are sent to the Statsd client code, which transforms the event to the metric name format used by the Statsd backend.
- The Statsd backend aggregates all the events with the same metric name using the configured aggregator (counter, timer or gauge – as described below).
The aggregation is done over a time window that is configured in Statsd (e.g., 60 seconds).
The Statsd backend assigns each aggregated sample a timestamp and sends the aggregated samples to the Anodot service using https.
Installation instructions:
Using a Docker, follow these instructions: https://hub.docker.com/r/anodot/anodot-statsd/
For further information on Statsd, see: https://blog.pkhamre.com/understanding-statsd-and-graphite/
- To install the client for Statsd in python:
A general description of the client-side with sample python code is at: https://pypi.python.org/pypi/statsd.
Each event should be reformatted to the Statsd format:
<metricname>:<value>|<type>
Anodot recommends the following format for metric names:
Attr1=value1.Attr2=value2.Attr3=value3.what=what_is_measured
Where AttrX is the name of an attribute, such as publisher, author, ad type, and value is the actual value of the AttrX. The “what” part describes what quantity being reported, such as, price, count of views, and count of clicks.
Metrics can be set to counters, timers or any other type described in https://github.com/etsy/statsd/blob/master/docs/metric_types.md.
Metrics that count events should be set to counters, while metrics that measure statistics of values related to the events (e.g., price), should be set to timers. Statsd produces statistics, such as average, median over the values of metrics set as timers, and summations of the values of metrics set to counters.
Note: Metric names must not contain the following characters:
space, : , | , ‘ , [ , ], ( , ) - To install the Statsd backend:
- Install nodejs (version >= 0.10.x ):
Manual install on ubuntu:
curl -sL https://deb.nodesource.com/setup | sudo bash -
sudo apt-get update
sudo apt-get install nodejs -
Manual installation example on Ubuntu 14:
sudo apt-get update
sudo apt-get install nodejs nodejs-legacy npm -
Manual installation example on Centos 6.5:
curl -sL https://rpm.nodesource.com/setup | sudo bash -
sudo yum install -y nodejs
sudo apt-get install nodejs nodejs-legacy npm - Install Statsd:
git clone https://github.com/etsy/statsd
cd statsd
npm install - Install the Anodot backend:
cd statsd
npm install statsd-anodot-backend --save - Create/edit the Statsd config file:
cd statsd
- Create config.js file and paste the following json:
{
  anodotApiToken: "<your_api_token>",
  backends: ["statsd-anodot-backend"],
  flushInterval: 60000,
  keyNameSanitize:false,
  anodotMetricFormat: "2.0"
} - Run Statsd:
cd statsd
sudo npm install forever -g
forever start stats.js config.js
- Install nodejs (version >= 0.10.x ):